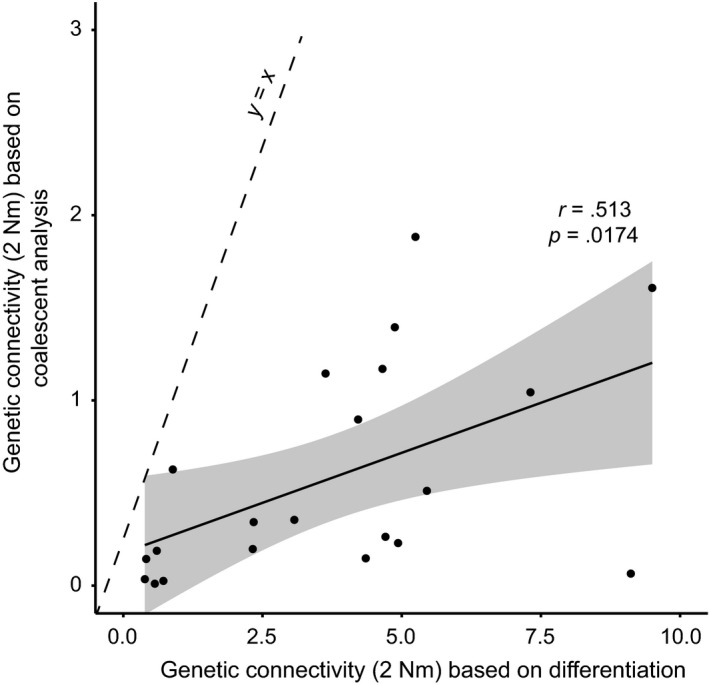
Figure 5.

Genetic connectivity estimated using coalescent isolation‐with‐migration analyses versus traditional approach based on Wright's island model; the former does not and the latter does assume that equilibrium between isolation and migration has been reached. Dashed line indicates x = y; solid line is linear regression trend line with 95% confidence interval (gray area)
