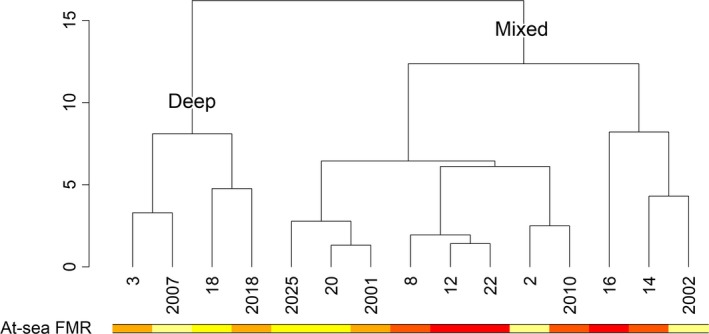
Figure 3.

Dendrogram of distance matrix of the first three principal components from the foraging strategy analysis showing how individual sea lions clustered together in multivariate space with respect to fine‐scale variation in foraging behavior. The color bar represents at‐sea FMR, with values ranging from low (yellow) to high (red). There was no correlation between behavioral and energetic distance matrices, illustrated here by the lack of distinct color clusters
