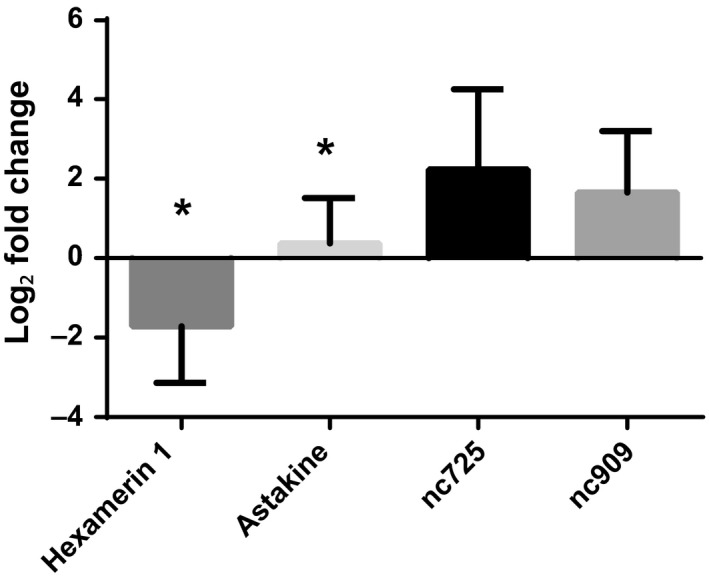
Figure 2.

Validation of gene expression with independent samples of four gene of interests found differentially expressed in the transcriptome analysis between mated versus alate queen brains. cDNA was synthesized from independently collected queens. Gene expression determined by qPCR was normalized to both elf1‐beta and rpl18. Bars represent mean log2 fold change ±SEM. “*” Indicates significant differences between virgin alate and mated queen brains determined by t test, p < .05, n = 4. Hexamerin 1 expression was significantly reduced in mated queen brain. The relative trends in gene expression reflect transcriptome results. p Values: hexamerin 1, .019; astakine, .039; nc725, .057; nc909, .484
