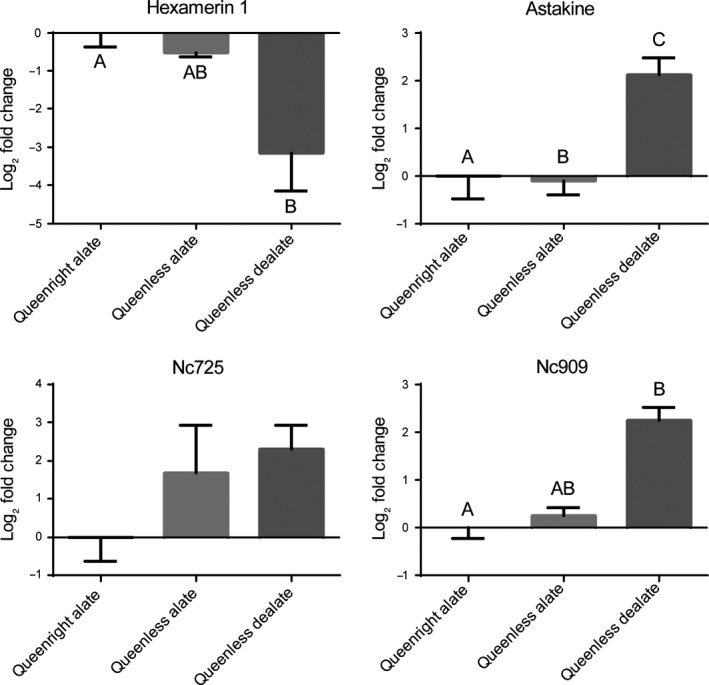
Figure 4.

Relative gene expression of four gene of interests in brains of queenright alate, queenless alate, and queenless dealate virgin queens. Gene expression determined by qPCR was normalized to both elf1‐beta and rpl18. Bars represent mean log2 fold change relative to queenright alates ±SEM, n = 4. Different letters indicate significant differences in gene expression as determined by one‐way ANOVA and Tukey's posthoc analyses (p < .05)
