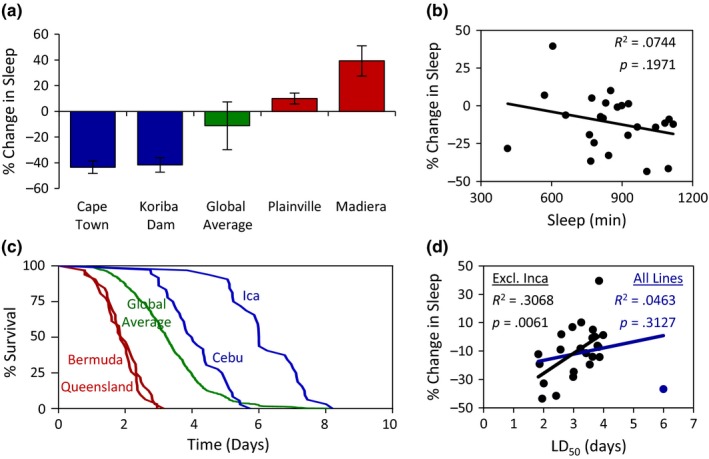
Figure 4.

The effect of starvation on sleep and longevity in Drosophila melanogaster populations. (a) There is significant variation in starvation‐induced changes in sleep duration (Wilcoxon rank‐sum test: χ2 = 185.9639, p < .0001). The change in sleep for the two shortest and longest sleeping populations is shown relative to the global average. For each population, data shown are mean ± SE. For global average, data shown are mean ± SD. (b) There is no relationship between sleep duration and starvation‐induced changes in sleep. (c) There is significant variation in measurements of starvation resistance (Log‐rank test: χ2 = 811.1161, p < .0001). Survivorship curves for the two least and most starvation resistant populations are shown relative to the global average. (d) The relationship between starvation resistance and starvation‐induced changes in sleep. The blue regression line includes Ica, Peru, the outlier population (blue dot), while the black regression lines do not. For measurements of starvation‐induced sleep suppression and starvation resistance for all localities, see Table 2
