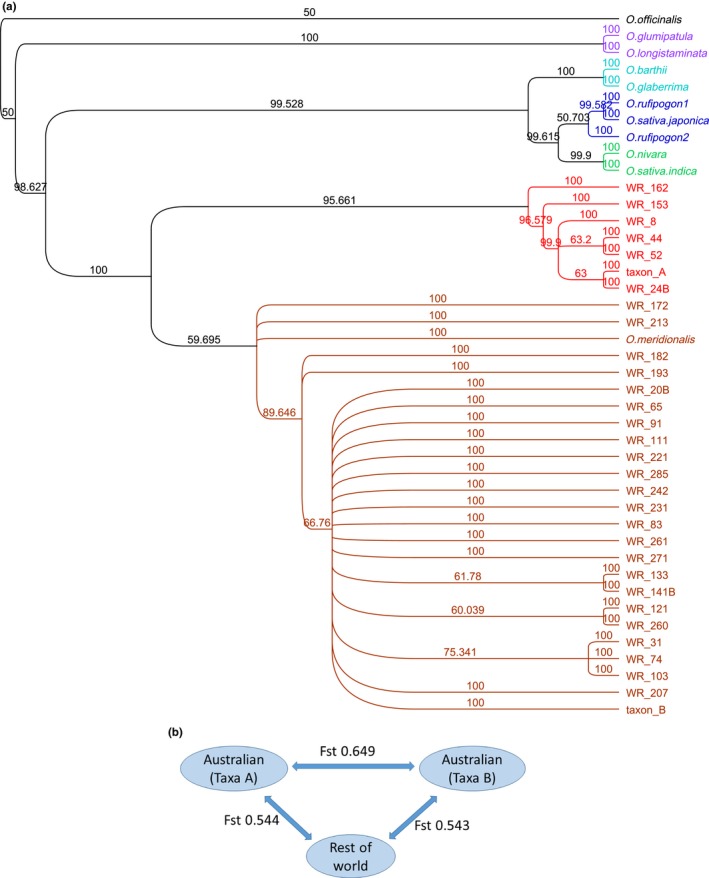
Figure 2.

Diversity of chloroplast genomes. (a) Phylogenetic tree based on MP analysis of whole chloroplast genome sequences. Colors relate to the main clades. Red and brown clades are from Australia. Bootstrap values (MP 1,000 replicates) are shown on the branches; (b) genetic distances between populations in Australia and elsewhere
