Figure 1.


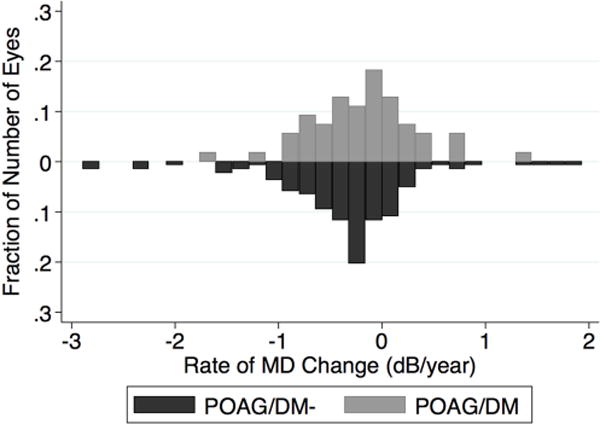
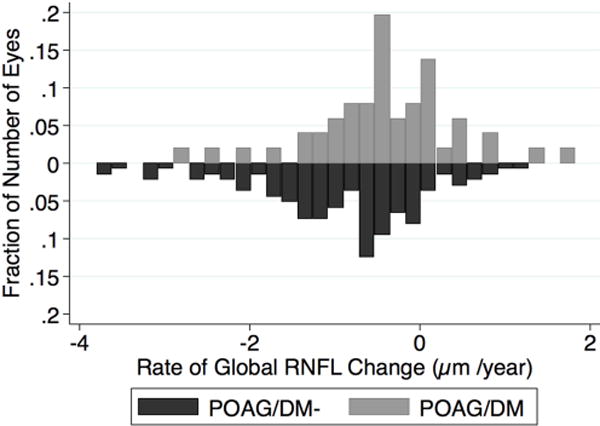
Bar graph showing the distributions of the rates of mean deviation loss and global retinal nerve fiber layer thinning in eyes of POAG/DM and POAG//DM- patients. MD=mean deviation; RNFL= retinal nerve fiber layer.


Bar graph showing the distributions of the rates of mean deviation loss and global retinal nerve fiber layer thinning in eyes of POAG/DM and POAG//DM- patients. MD=mean deviation; RNFL= retinal nerve fiber layer.