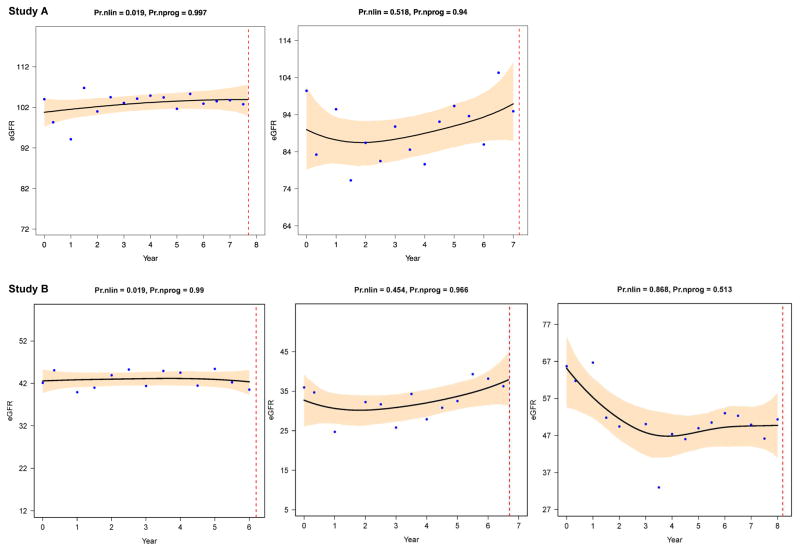
Figure 3. Nonprogressive patterns in Study A (top) and B (bottom).
These 5 examples of individual eGFR trajectories have high probability of nonprogression (Pr.nprog > 0.5, often > 0.9). The upper row left figure shows an example of a linear (probability of nonlinearity very low) nonprogressive eGFR trajectory from a Study A participant with a truncating PKD2 mutation; the upper right figure shows a nonlinear (probability of nonlinearity > 0.5) nonprogressive pattern from a Study A participant with a truncating PKD1 mutation. The bottom row left and middle figures show 2 examples of stable (Pr.nprog > 0.9) eGFR in Study B participants with low eGFR at baseline, the left figure from a participant with a truncating PKD1 mutation and the middle figure from a subject with no mutation detected. The bottom right figure is an example of nonlinear (Pr.nlin > 0.5) nonprogression (Pr.nprog > 0.5): an initial rapid eGFR decline is followed by an extended (> 4.5 years) period of nonprogression; the trajectory is from a Study B participant with a truncating PKD1 mutation. Setup is the same as in figure 1. Figure courtesy of L. Lee.

