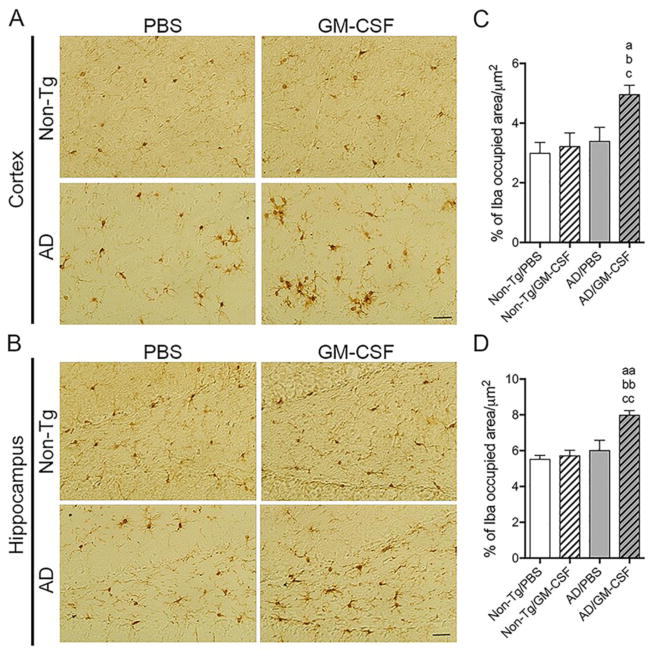
Fig. 7.
GM-CSF treatment increases area occupied by Iba1-positive microglia in AD mice brains. (A, B) Representative images of Iba1 staining in the cortex (A) and the hippocampus (B) of the non-Tg and AD mice brains received PBS or GM-CSF. Scale bar = 200 μm. (C, D) Quantification of area occupied by Iba1-positive cells including cell processes per area (μm2) in cortex (C) and hippocampus (D) (n = 5 per group, 12 sections per brain, 3 areas per section). Data represent mean percentage of Iba1 occupied area/μm2 ± SEM, and ap ≤ 0.05, aap ≤ 0.01, bp ≤ 0.05, bbp ≤ 0.01, cp ≤ 0.05 and ccp ≤ 0.01 compared to a,aanon-Tg/PBS, b,bbnon-Tg/GM-CSF, or c,ccAD/PBS as determined by one-way ANOVA and Newman-Keuls post-hoc test.

