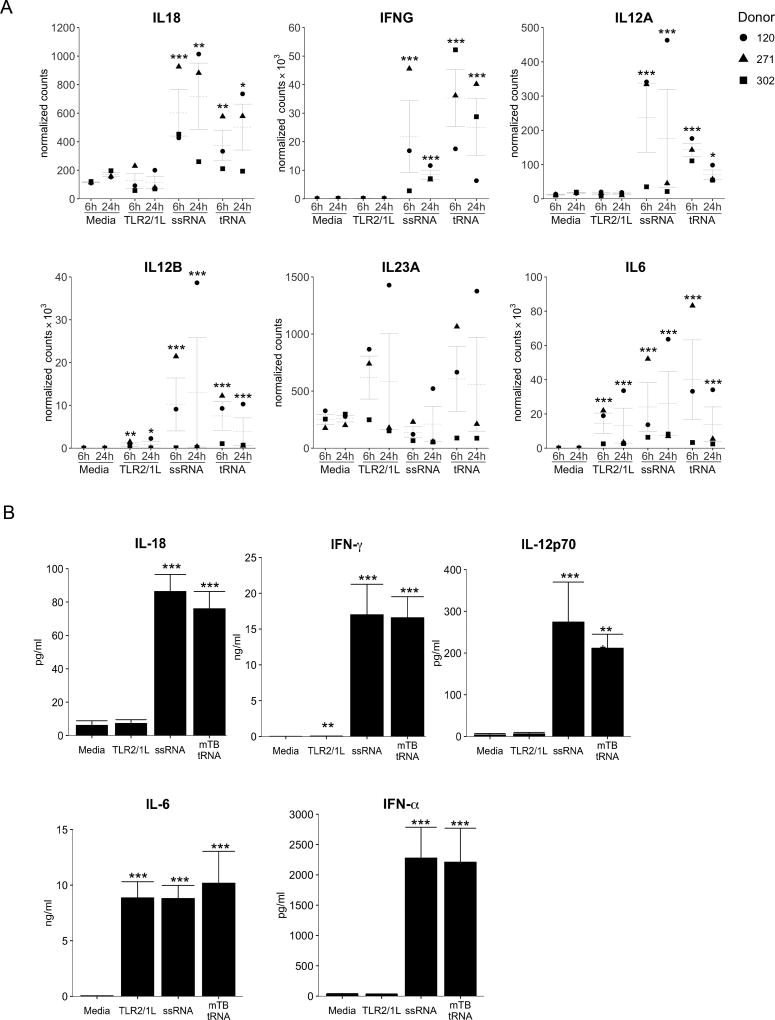
Fig 4. Analysis of genes characteristic of Th1 differentiation and validation in PBMC.
(A) Log-transformed, normalized counts for select genes at 6h and 24h, mean ± SEM, statistical significance of differential expression (as compared to media at each timepoint) is reported as Benjamini-Hochberg adjusted p-value. (B) PBMC were stimulated with mTB tRNA, ssRNA or TLR2/1L and cytokine secretion measured at 24h. (n=20). Statistical significance of ligand-stimulated PBMC vs. media control calculated by one-way repeated measures ANOVA followed by Dunnett’s multiple comparisons test. *p<= 0.05, ** p<=0.01, *** p<=0.001

