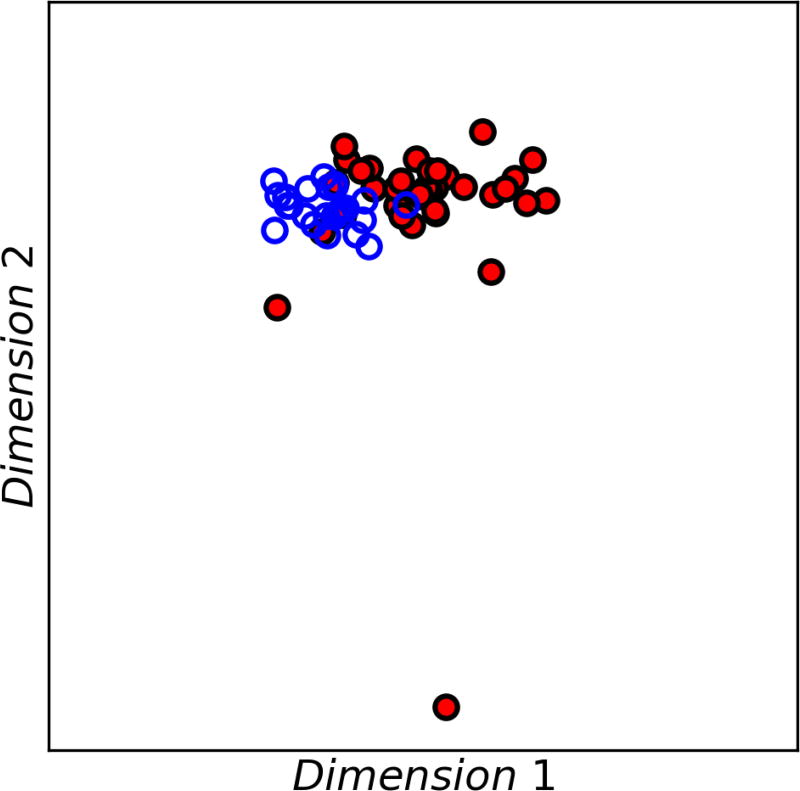
Figure 4.
KLD-MDS plot showing data for all three experiments. Plots were constructed using the distribution of particle diameter, aspect ratio, circularity, and average intensity in the FIM datasets. Although the plot lacks resolved clusters for the SUV (open blue circles) and MUV samples (red-filled circles), the datasets still exhibit noticeable segregation by formulation indicative of a formulation dependency in the subvisible particle populations.

