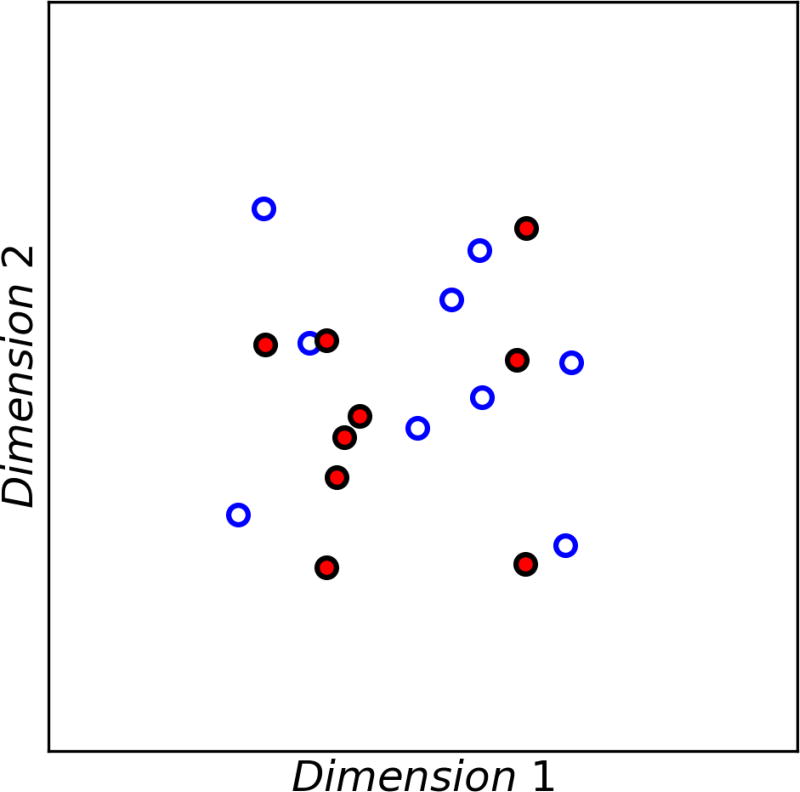
Figure 5.
KLD-MDS plot of the IVIg particles suspended in SUV (red-filled circles) and MUV (open blue circles) formulation buffers. As in figure 3 plots were constructed using the distribution of particle diameter, aspect ratio, circularity, and average intensity in the FIM datasets. Visually the clustering present in figures 3–4 is mostly absent when both formulations contain identical particles, suggesting that the refractive indices of the two formulations does not significantly influence the KLD-MDS analysis.

