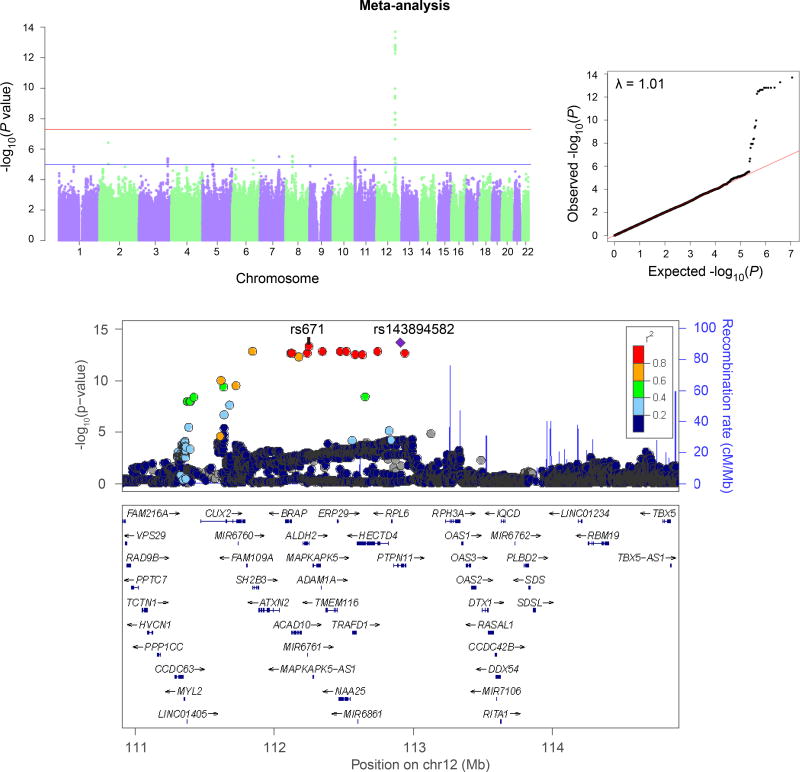
Figure 1.
Manhattan and QQ plots (above) and regional Manhattan plot (below) for Flushing (meta-analysis). (Results for the individual samples are shown separately in Supplemental Figure 2.) Regional Manhattan plot shows locations of the lead SNP (rs143894582) and functional variant rs671.

