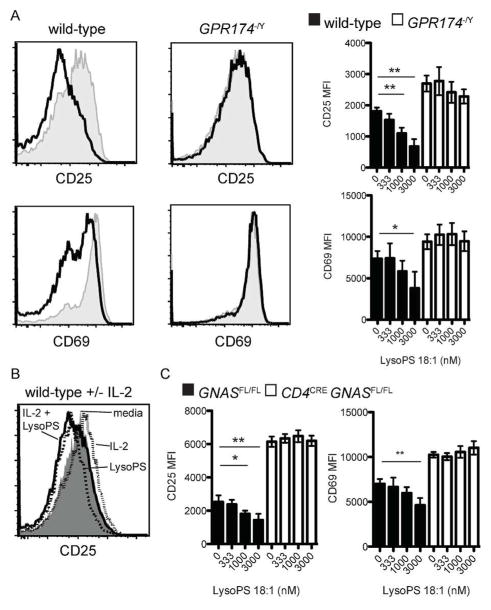
Figure 4.
LysoPS suppresses early T cell activation via GPR174 and Gαs. (a) Levels of CD25 and CD69 were determined by flow cytometry 24 after activation of naive CD4+ T cells incubated with plate-bound anti-CD3 and anti-CD28 for three days.. On the left, histograms of cells activated without LysoPS (gray, shaded) or in the presence of 3 μM 18:1 LysoPS are shown; MFI values for cells cultured with the indicated LysoPS concentrations are shown on the right. (b) Levels of CD25 expression are shown for cells activated as in (a) for 24 h in the presence of media alone (gray, shaded), media with 1000 U IL-2 (dotted line, open), media with 3 μM 18:1 LysoPS (dashed line, open), or media with 3 μM 18:1 LysoPS and 1000 U IL-2 (solid line, open). (c) Levels of CD25 and CD69 expression were measured as in (a) for Cd4creGnasfl/fl naive CD4+ T cells; * P < 0.05; ** P < 0.01. Data are representative of three independent experiments. Error bars indicate standard deviation for triplicate measurements.

