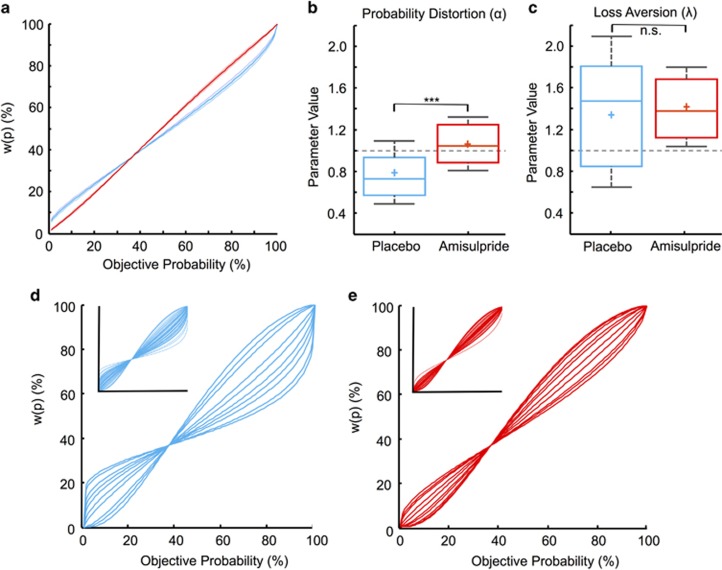
Figure 3.
Effects of amisulpride on probability distortion and loss aversion. (a) Average probability weighting functions were less distorted in the amisulpride group (red) than in the placebo group (blue). (b) Accordingly, probability distortion (α) parameters were significantly closer to 1 for the amisulpride compared with the placebo group. (c) Groups did not differ significantly in mean loss aversion (λ) parameters. In (b) and (c), boxplots show the mean (+) and median (−); *** indicates p<0.001; n.s. indicates no significant difference; boxes represent 25th and 75th percentiles and whiskers the 9th and the 91st percentile, with the gray dashed line representing 1 (ie, linearity). (d) To better visualize individual probability weighting functions we randomly selected 15 participants in the placebo group (whole group shown in inset). Similar to the full group, probability distortions were more pronounced and varied more widely in these participants. (e) In contrast, the amisulpride group showed more homogeneous and reduced probability distortions, both in randomly selected 15 participants and in the full group (inset).

