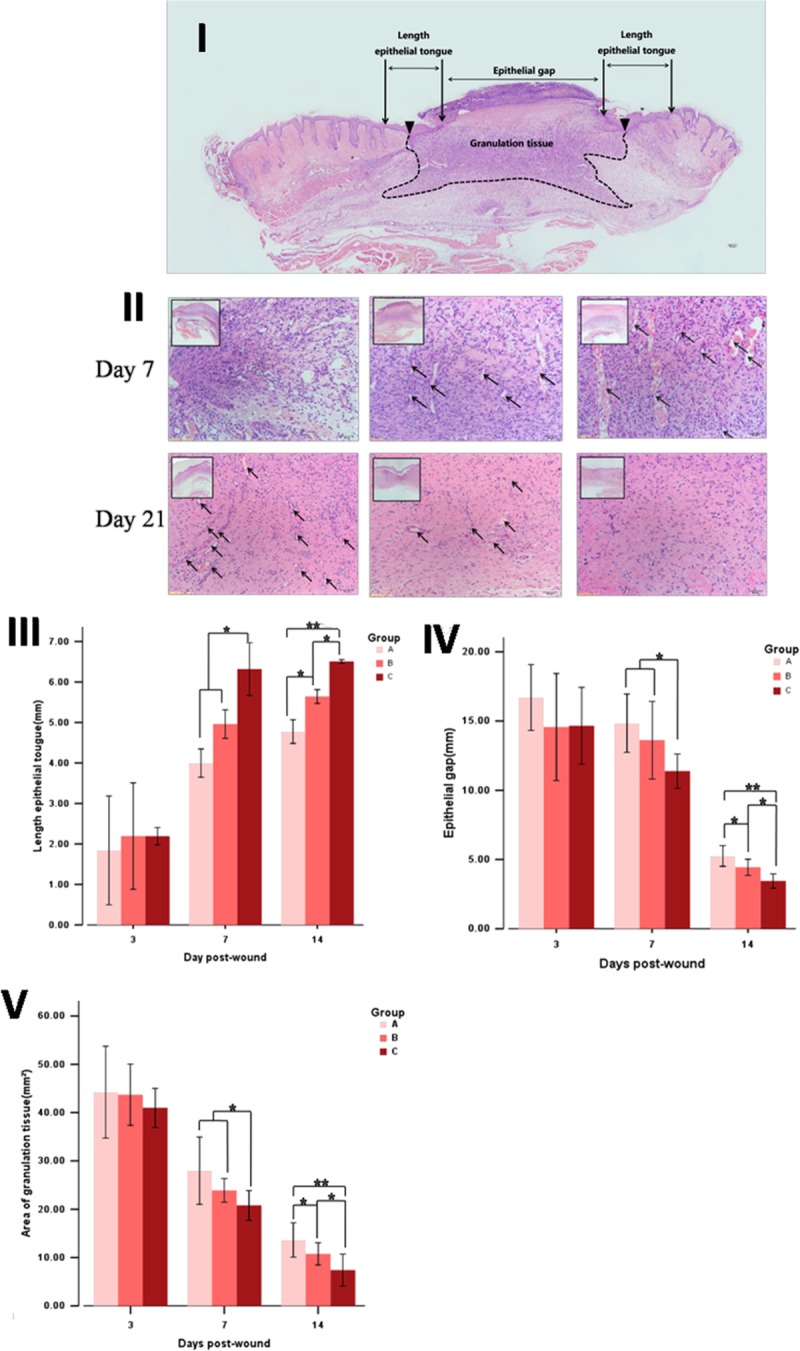
FIGURE 2.

Histological analysis of skin after hematoxylin and eosin staining. (I) A schematic transversal section is depicted for proper identification of the respective regions observed. (II) Images of granulation tissue were obtained from the healing. The arrows point to the blood vessels (allows) that grow perpendicular to the wound in days 7 and 21 after treatment. Measure and analysis of length epithelial tongue (III), epithelial gap (IV) and area of granulation (V). All data are mean ±SD (n = 3). *P < 0.05 ; **P < 0.01.
