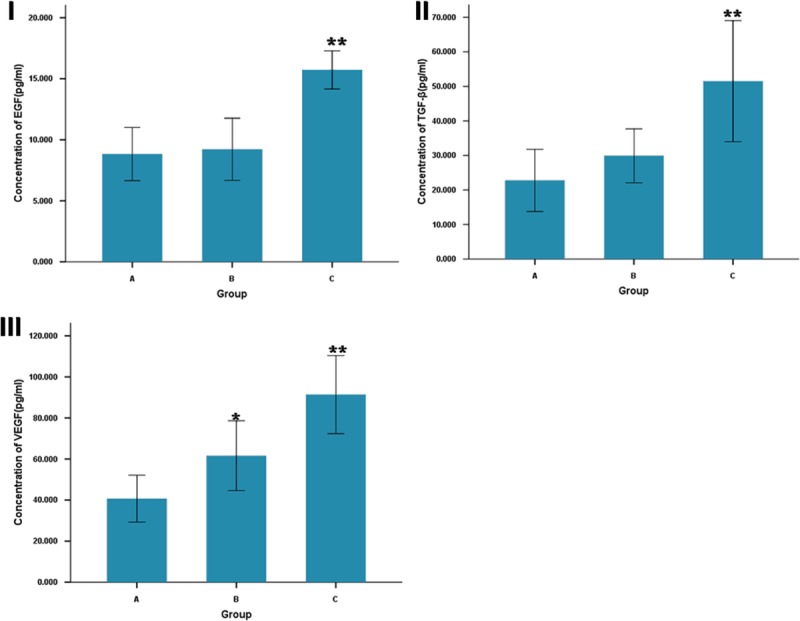
FIGURE 5.

ELISA analysis of wound tissue for concentration of EGF (I), TGF-β (II), and VEGF (III). Comparison of the concentration of Three Growth Factors between ADSC-SF/CS-treated (C), SF/CS-treated (B) and control groups (A) at 14 days post-wound. **P < 0.01, comparison between ADSC-SF/CS-treated and control groups; *P < 0.05, comparison between ADSC-SF/CS-treated and SF/CS-treated groups.
