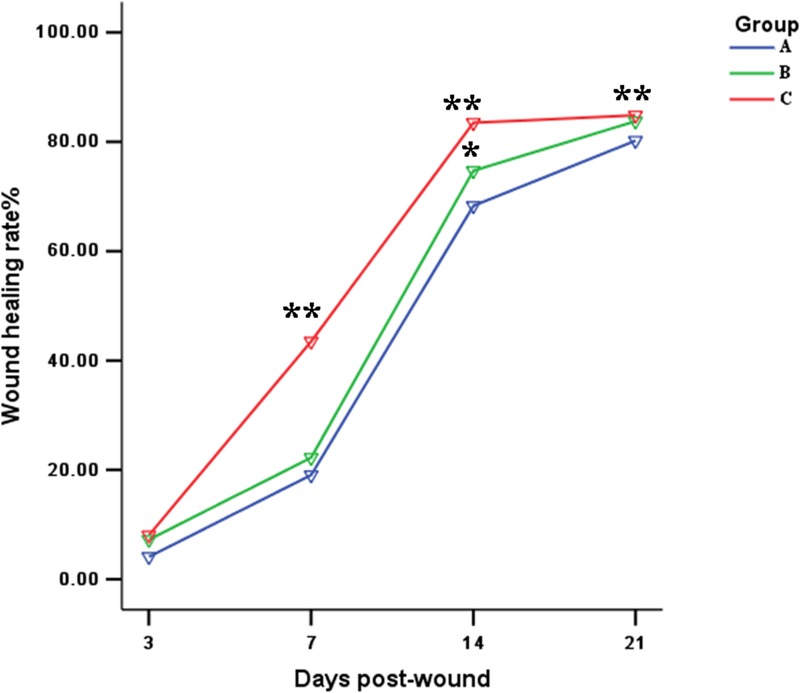
FIGURE 7.

Analysis of Wound Closure Rates The values were averaged and are reported as mean ± SD (n=3). *Significant differences between group B (SF/CS) and group A (control), P<0.05; **Significant differences between group C (ADSC-SF/CS) and group A (control) or B (SF/CS), P<0.01.
