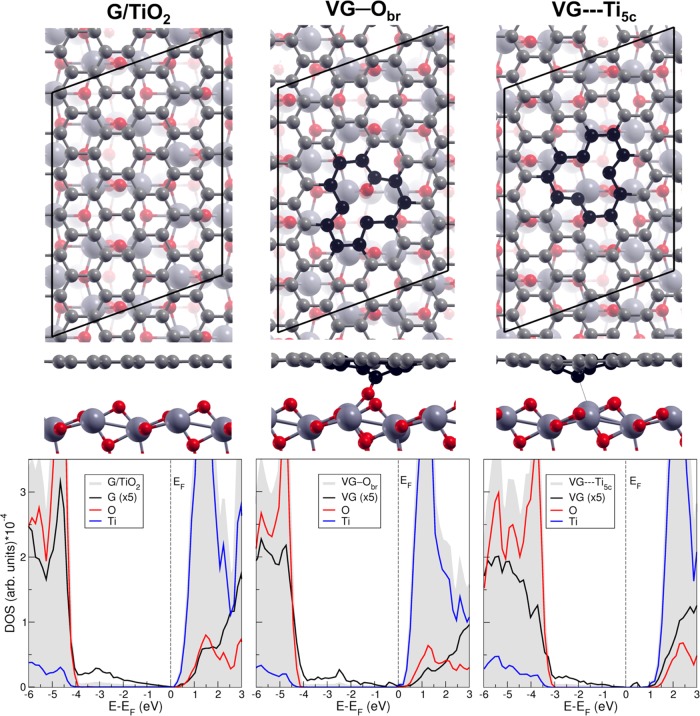
Figure 3.
Top and side views of G/TiO2, VG—Obr, and VG---Ti5c interfaces (top and middle lines) along with the density of states (bottom line). The C atoms at the vacancy are highlighted in black, and the other C atoms are shown in light gray. Small red balls represent O atoms, and big dark gray balls represent Ti atoms. In the DOS, the filled gray area represents the total DOS and the black line is DOS-projected on graphene (G or VG), which is ×5 for clarity. The red and blue lines are DOS-projected on all O and all Ti atoms in the TiO2 slab, respectively. Fermi energy (EF) is set at the eigenvalue of the highest occupied states.

