
Figure 5.
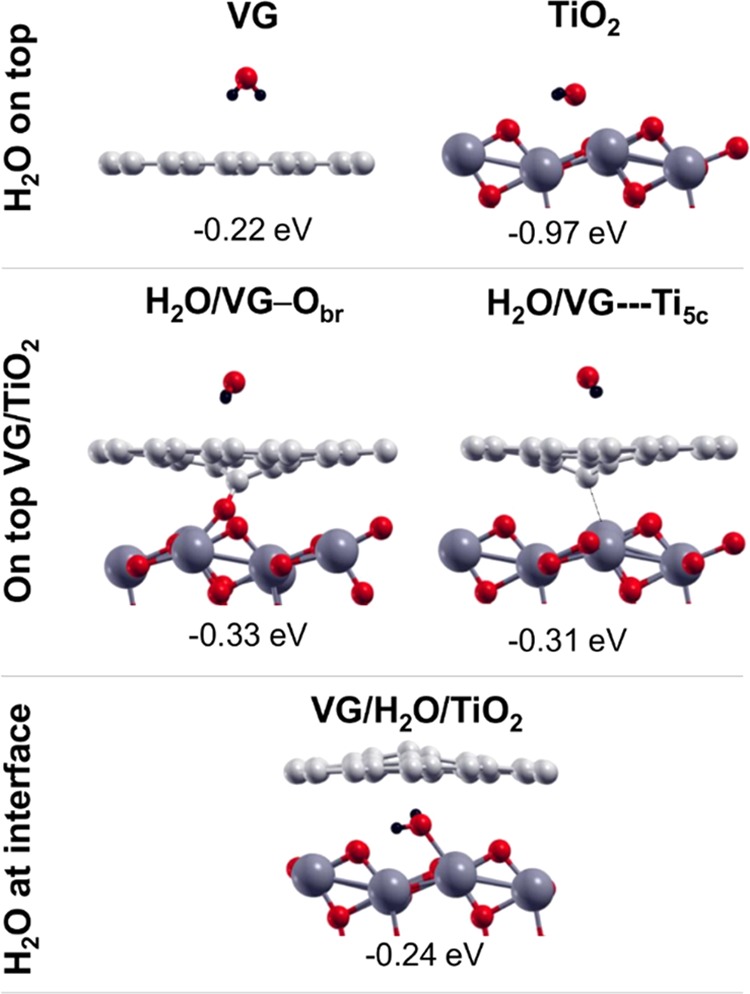
Side views of molecular water adsorption on top of freestanding VG and TiO2(101) surface (top line), side views of molecular water adsorption on top of the most stable two VG/TiO2 interfaces (middle line), and molecular water adsorption at the VG/TiO2 interface (bottom line). Labels and adsorption energies are reported above and below each configuration, respectively, and defined in Section 2. Small red, light gray, and black balls represent O atoms, C atoms, and H atoms, respectively. Big dark gray balls represent Ti atoms.