Figure 4.
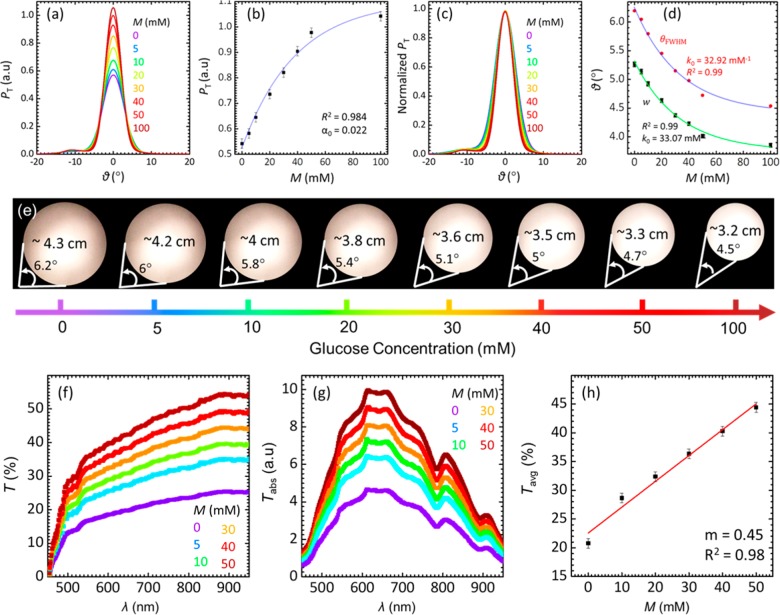
Quantification of glucose using the imprinted hydrogel sensor with a broadband light source for the concentration range of 0 ≤ Μ ≤ 100 mM. (a) P–θd trend of hydrogel sensor for different glucose concentrations. (b) Pmax plotted against various glucose concentrations, M. (c) Normalized transmitted power of the broadband light versus the diffusion angle, showing the change in the diffused spot diameter with increasing glucose concentrations. (d) Exponential fit for the fwhm and w conceived from (c). (e) Photographs of diffused broadband light spots after passing through the sensor submerged in different glucose concentration solutions. The diameter was restricted at fwhm of the transmitted power. (f) Transmission spectra of the sensor for varying glucose concentration. (g) Absolute transmittance for increasing glucose concentration. (h) Average transmission of the sensor over 450–800 nm in various glucose concentrations.

