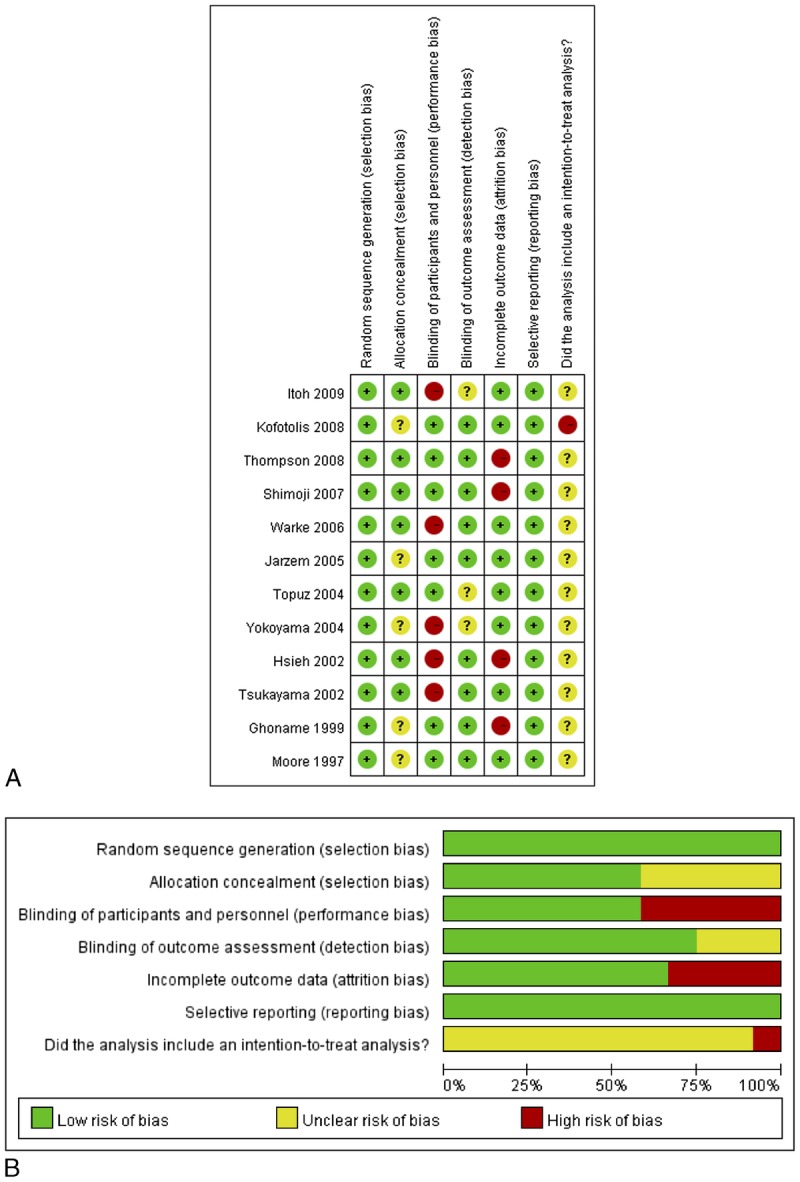
FIGURE 3.

Quality assessment results. The green circles indicate lack of bias; red circles indicate the presence of bias. A, Risk of bias for each included study. The studies were assessed for 5 types of bias and for the use of an intent-to-treat analysis. B, The overall summary of bias of the 16 studies.
