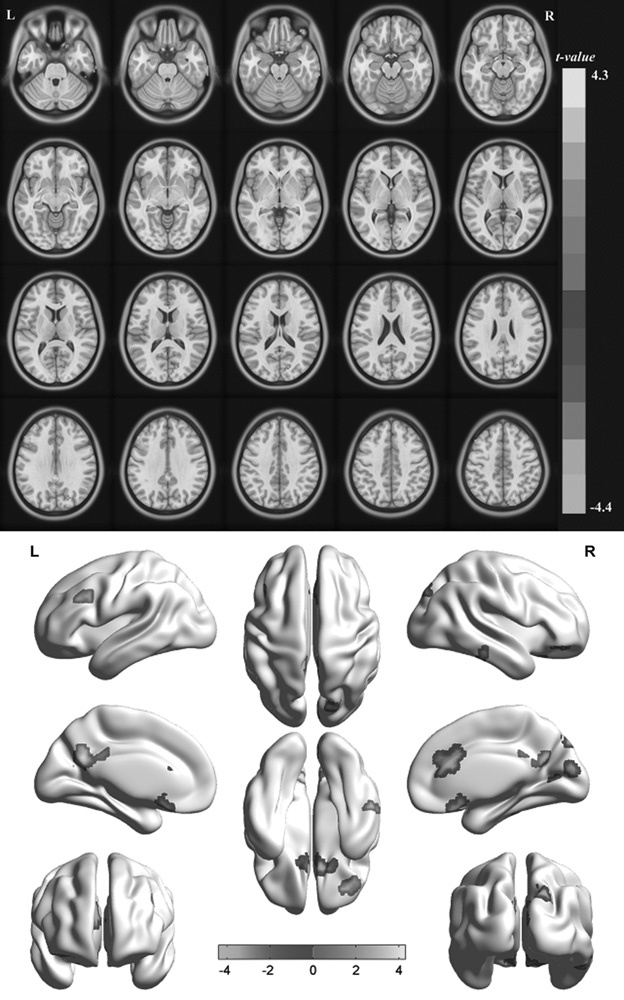
Fig. 1.

Spontaneous brain activity in the monocular blindness and healthy control groups. Significant activity differences were observed in the right rectal gyrus, right cuneus, right anterior cingulate, right lateral occipital cortex, right inferior temporal gyrus, right frontal middle orbital, left posterior cingulate/precuneus, and left middle frontal gyrus. Black denotes higher regional homogeneity values. [P<0.01 for multiple comparisons using Gaussian random field theory (z>2.3, P<0.01, cluster>40 voxels, AlphaSim corrected)].
