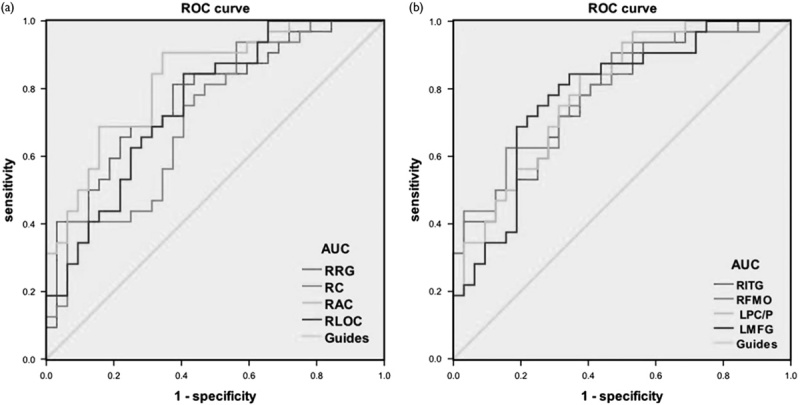
Fig. 3.

ROC curve analysis of the mean regional homogeneity values for altered brain regions. The AUCs were 0.771 (P<0.001; 95% CI: 0.657–0.886) for the RRG, 0.715 (P=0.003; 95% CI: 0.589–0.840) for the RC, 0.828 (P<0.001; 95% CI: 0.729–0.927) for the RAC, and 0.756 (P<0.001; 95% CI: 0.639–0.873) for the RLOC (MBs<HCs). (a) The AUCs were 0.778 (P<0.001; 95% CI: 0.667-0.889) for the RITG, 0.795 (P<0.001; 95% CI: 0.687–0.903) for the RFMO, 0.793 (P<0.001; 95% CI: 0.685–0.901) for the LPC/P, and 0.782 (P<0.001; 95% CI: 0.668–0.897) for the LMFG (MBs>HCs) (b). AUC, area under the curve; CI, confidence interval; HC, healthy control; LMFG, left middle frontal gyrus; LPC/P, left posterior cingulate/precuneus; MB, monocular blindness; RAC, right anterior cingulate; RC, right cuneus; RFMO, right frontal middle orbital; RITG, right inferior temporal gyrus; RLOC, right lateral occipital cortex; ROC, receiver operating characteristic; RRG, right rectal gyrus.
