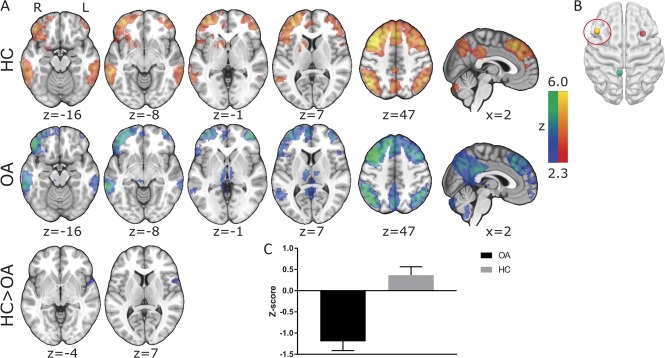
Figure 3.
Resting-state connectivity in (A) healthy controls (HCs), patients with chronic knee osteoarthritis (OA) and differences between these groups (FWE P < 0.05) of the (B) left dorsolateral prefrontal cortex. (C) Mean (+SEM) z values of those clusters displaying a significant group difference are displayed on a bar graph to visualise the anticorrelations observed in patients with chronic knee OA. All slice images are displayed in radiological convention (right hemisphere is displayed on the left of the figure).

