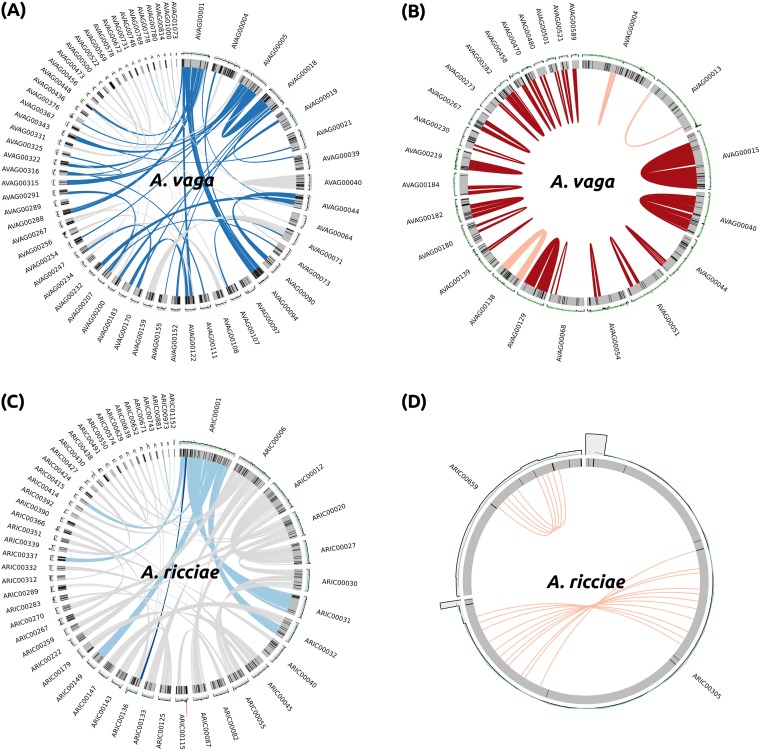
Fig 6. Unusual genomic features are not detected in A. ricciae.
Genomic scaffolds are shown as grey bars, GC content (green line), and read coverage (grey histogram) averaged over 5-kb bins are shown above each scaffold. Black lines within scaffolds represent gaps (Ns) introduced during scaffolding. (A) Example of collinearity breaks in A. vaga 2013 assembly scaffold AVAG00001. Links between homologous blocks are shown in light blue; downstream connections are shown in grey. Collinearity breaks are shown in dark blue. (B) The majority of homologous blocks encoded on the same scaffold in the A. vaga 2013 assembly are palindromes (dark red); tandem repeats are shown in pink. (C) Example of a single collinearity break on A. ricciae scaffold ARIC00001. (D) No genomic palindromes detected in A. ricciae. Only 2 homologous blocks were found on the same scaffold (ARIC00305 and ARIC00659), both arranged as tandem repeats. GC, guanine-cytosine.

