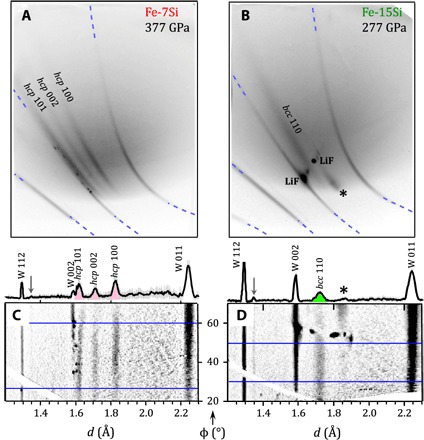
Fig. 2. X-ray diffraction patterns of Fe-Si samples.

(A and B) Examples of raw (unprocessed) image plate panels. Image plate positions were calibrated using ambient pressure W-pinhole diffraction lines (dashed blue lines). (C and D) Projection of the above image plates into d-spacing − φ coordinates. The one-dimensional (1D) x-ray diffraction patterns at top were integrated over the region between the blue horizontal lines. Diffracted peaks from Fe Hα radiation (6.963 keV) are also observed (gray arrows). Asterisks (*) in (B) and (D) denote an extended feature which has a d-spacing consistent with either hcp (100) or diamond (111), as discussed in the text.
