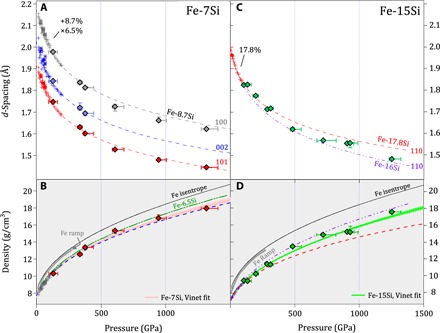
Fig. 3. Measured diffraction peaks and density of Fe-Si alloys as a function of pressure.

From measured (A) d-spacings of ramp-loaded Fe-7Si, we determine (B) the density of the hcp structure as a function of pressure. A Vinet equation of state fit to the data along the ramp-compression path is compared to measured and extrapolated diamond anvil cell experiments: *, green dash-dotted line = Fe-6.5Si (23); +, blue dashed line = Fe-8.7Si (11). (C) d-spacing and (D) density of ramp-loaded Fe-15Si interpreted as a bcc structure. Measured/extrapolated isotherms: +, red dashed line = Fe-17.8Si (11); purple dash-dotted line = Fe-16Si (14). For comparison, the pressure-density path of ramped Fe to 300 GPa (26) and the Fe-isentrope from Sesame EOS table 2150 (27) are shown.
