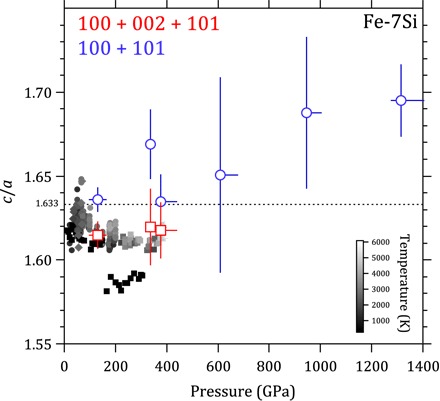
Fig. 4. c/a ratio as a function of pressure for Fe-7Si.

The unit cell ratios of hcp-structured Fe-7Si alloy were calculated from the x-ray diffraction patterns using all three observed hcp reflections (red squares) or only the two stronger reflections (blue circles). Low-pressure DAC data (gray symbols) predict a relatively modest increase in c/a ratio with increasing temperature (15, 23), approaching closer to the ideal hcp ratio of 1.633.
