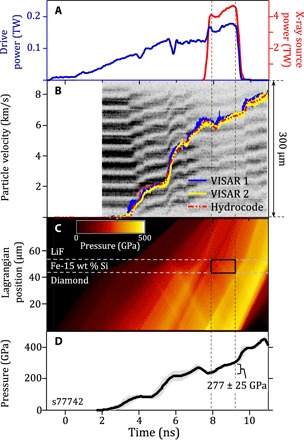
Fig. 8. Timing and pressure determination of an Fe-15Si ramp-compression experiment (LiF window).

(A) Composite laser drive for shot #77742 (277 ± 25 GPa) (blue trace). X-rays are generated using square pulses (red trace). (B) Raw interferogram from VISAR records sample-LiF particle velocity, which is reproduced by hydrocode simulations (red dashed curve) to determine (C) pressure history in the target package. The black rectangle represents the sample pressure conditions during the x-ray probe period (bounded by vertical dashed lines). (D) Calculated pressure history of the Fe-15Si sample.
