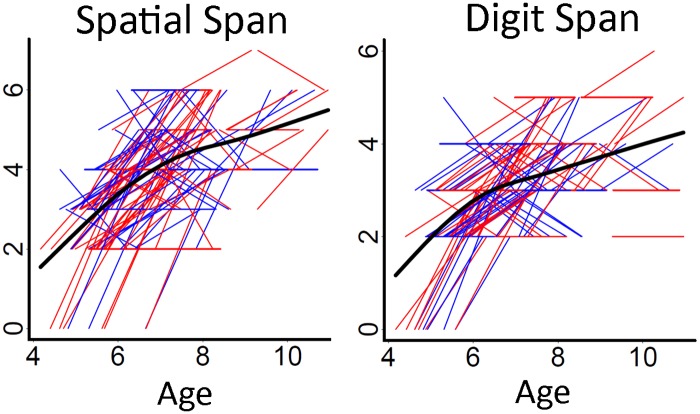
Fig 1. Spatial Span Backward and Digit Span Backward scores with age.
Spaghetti plots of individual participant change in Spatial Span Backward and Digit Span Backward scores with age (years). Females are plotted in red and males in blue. For each measure, an assumption-free general additive mixed model as a function of age was fitted to accurately describe group-level changes across the age range.

