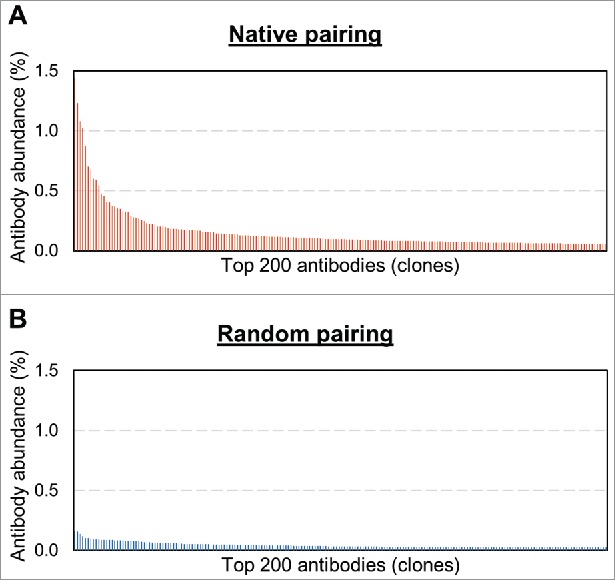
Figure 2.

Relative oligoclonality of the two scFv libraries. (A) Natively paired scFv bar plot. (B) Randomly paired scFv bar plot. First, deep sequencing was used to tabulate the frequencies of scFv clones in each repertoire. Frequency is computed as the count of sequence instances of a given scFv clone divided by the total sequence instances in the deep sequencing data set. The 200 most frequent scFv clones from each repertoire were sorted from the most frequent sequence to the least frequent sequence. The frequencies for each scFv repertoire were then plotted. Note that each repertoire comprises a “long tail” of many more than 200 antibody sequences that are not shown.
