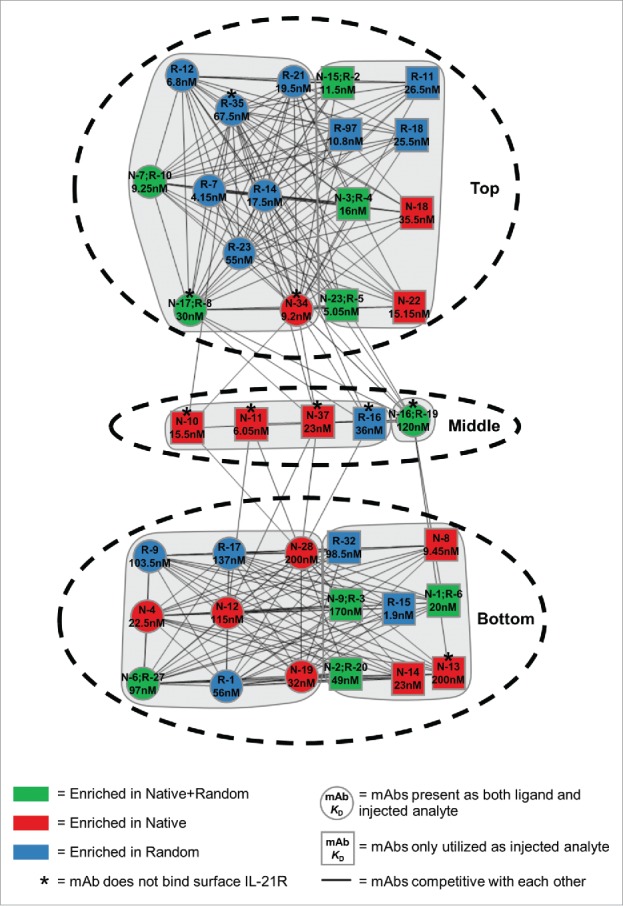
Figure 5.

Epitope binning analysis for full-length anti-IL-21R mAbs. MAbs that were competitive with each other are indicated by a connecting line and therefore bind a similar epitope. MAbs with highly similar competition profiles were grouped together within communities (grey regions). The three major, distinct communities were indicated by the black hashed ovals. Circles represent mAbs that regenerated well as immobilized ligands and had both ligand and analyte competition profiles. Squares represent clones where the competition data was only available in the analyte direction. The affinity (KD) of each mAb is indicated inside each shape. The color of the shape indicates whether the mAbs were enriched in both native+random libraries (green), the native only library (red), or the random only library (blue). *, indicates mAbs that did not bind surface expressed IL-21R by FACS.
