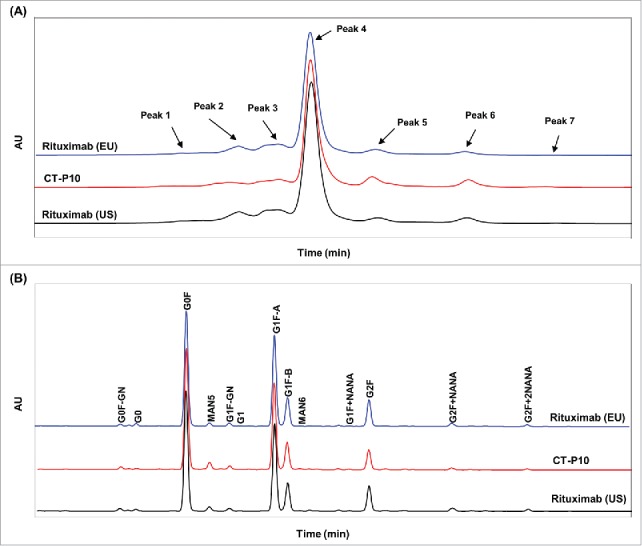
Figure 4.

Comparison of charge variants and oligosaccharide profiles of CT-P10 (red), EU-Rituximab (blue) and US-Rituximab (black). (A) Representative ion exchange chromatograms analyzed by cation exchange-HPLC are presented for 1 batch of each product. The number and distribution of IEC-HPLC peaks are conserved between CT-P10 and RMPs. (B) Representative oligosaccharide profiles analyzed by HILIC-UPLC with 2-AB labeling are presented for 1 batch of each product. The types and proportions of the glycans are conserved among the products.
