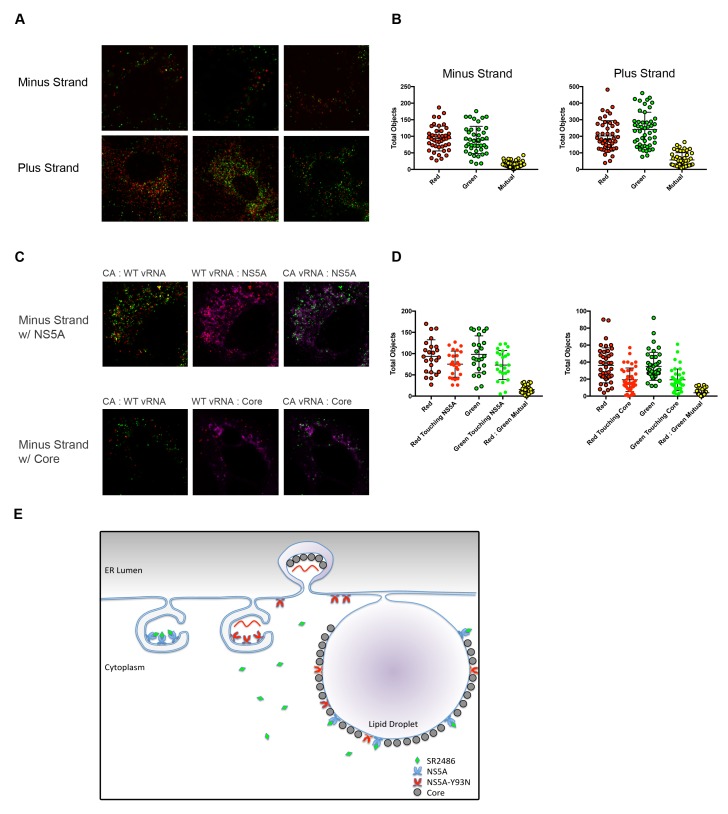
Figure 6. Drug-susceptible and drug-resistant RNA replication complexes segregate in coinfected cells.
(A) Huh7.5.1 cells were coinfected with CA and WT-Y93N at a MOI of 1 FFU/cell for 24 hr. Cells were fixed and co-stained with WT and CA negative-strand or positive strand viral RNA probe sets and visualized by confocal microscopy. Co-infected cells were identified and three representative images are displayed of more than 50 captured images. (B) Volocity was used to identify and quantify vRNA puncta within coinfected cells. These puncta were then assessed for colocalization and quantified. (C) Huh7.5.1 cells were coinfected with CA and WT-Y93N at a MOI of 1 FFU/cell for 24 hr. Cells were costained to visualize Core or NS5A together with CA and WT vRNAs. Representative cells are displayed demonstrating all pairwise comparisons analyzed for colocalization. (D) Volocity was used to quantify the number of vRNAs per cell, the number of colocalized vRNAs, as well as the number of vRNA puncta touching NS5A or Core. (E) Depiction of the clonal nature of individual RNA replication sites (Adapted from Figure 9 in Zayas et al., 2016]). Membrane invaginations house either drug-resistant (red) or drug-susceptible (blue) genomes. In the model, the RNA replication sites are segregated and therefore only the RNA from drug-resistant virus is amplified in the presence of inhibitors of RNA replication. It is visually suggested that NS5A molecules that bring core protein to lipid droplets for viral assembly mix on this surface and that this could lead to genetic dominance of drug susceptibility at a packaging step.

