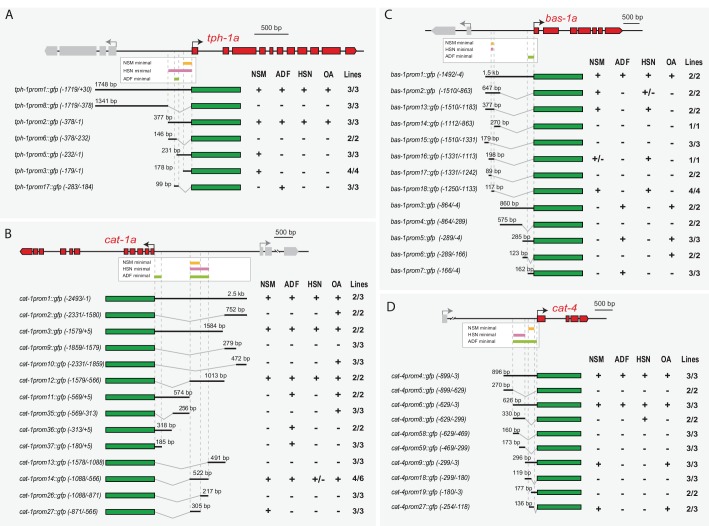
Figure 4. Distinct cis-regulatory modules control serotonin pathway gene expression in different subclasses of serotonergic neurons (A–D) cis-regulatory analysis of the 5HT pathway genes.
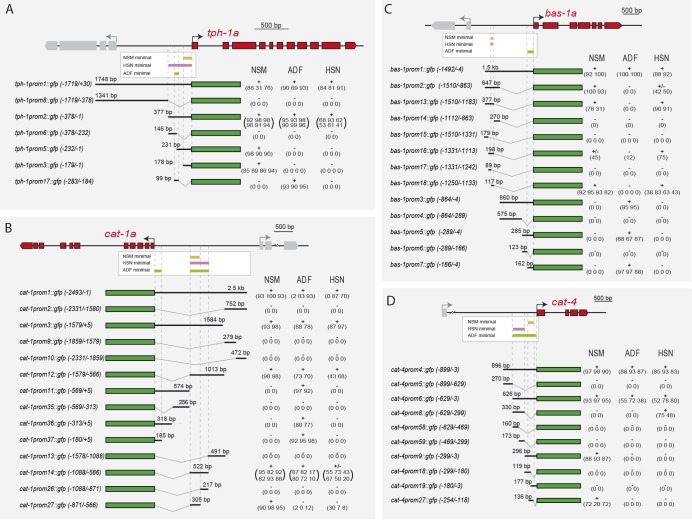
White boxes underneath each gene summarize the smallest CRM that drive expression in each serotonergic neuron subclass. Thick black lines symbolize the genomic region placed upstream of GFP (green box) and dashed lines are used to place each construct in the context of the locus. OA: other aminergic cells (RIC, RIM, AIM, RIH, CEPs, ADE, PDE, VC4/5) that also share the expression of some 5HT pathway genes. Numbers in brackets represent the coordinates of each construct referred to the ATG. +: >60% GFP positive cells; +/−: 20–60% GFP cells; −: <20% GFP cells. x/y represents the number of lines with the expression pattern (x) from the total lines analyzed (y). n > 60 cells per line. See Figure 4—figure supplement 1 for raw values.


