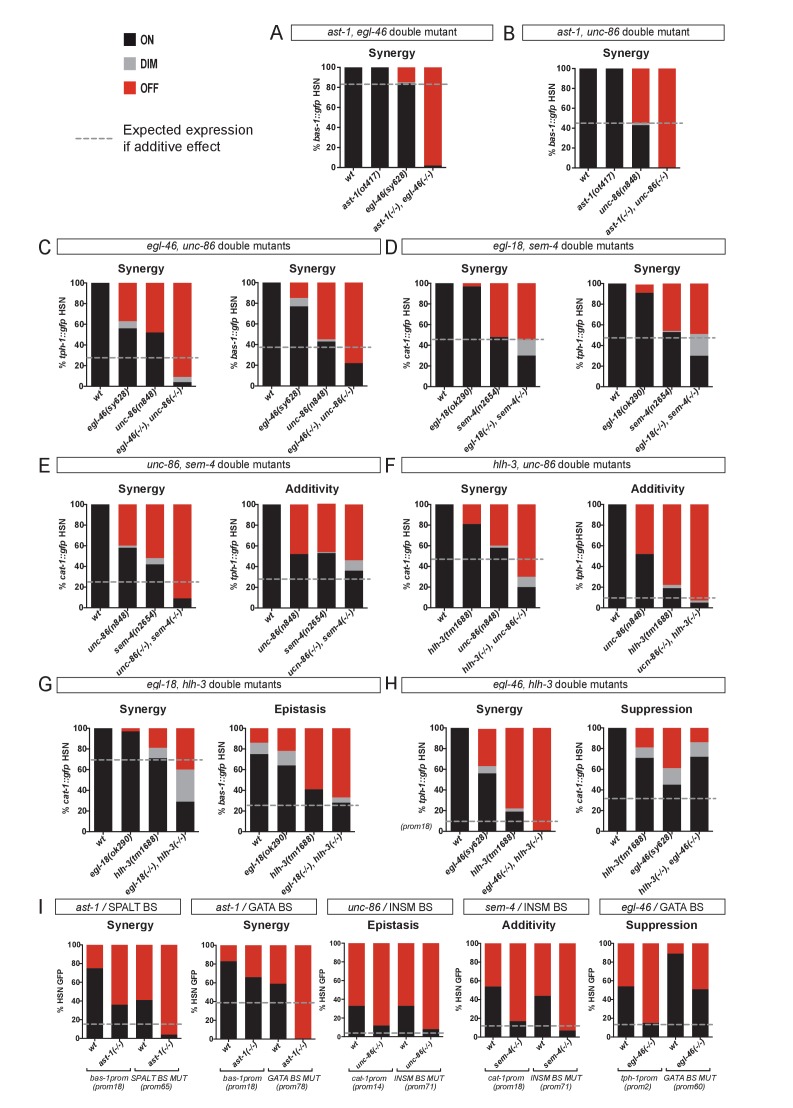
Figure 6. HSN TF collective shows enhancer-context dependent synergistic relationships.
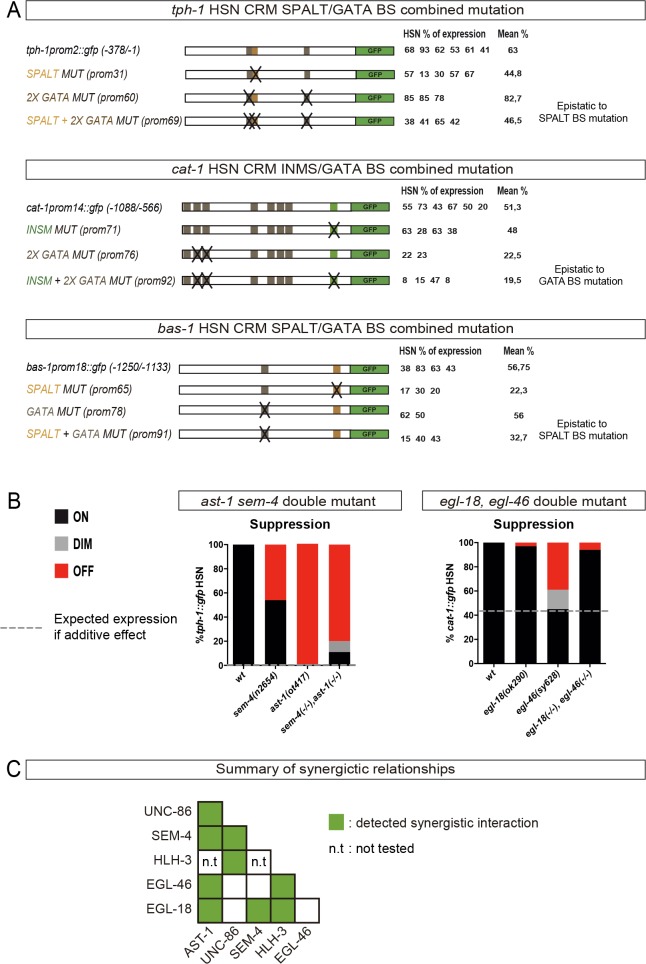
(A–H) Double mutant analysis of different pairs of the HSN TF collective. Expression level expected from additive effects (calculated as the product of single mutant expression values) is marked with a dotted line. Double mutant phenotypes statistically different from additive effect (Pearson’s chi-squared test) are classified as synergistic (if phenotype is stronger than additive), epistatic (if phenotype is similar to one of the single mutants) or suppression (if phenotype is milder than the expected for additivity or the single mutants). The majority of the double mutant combinations show synergistic effects. n > 100 cells each genotype. See Figure 6—figure supplement 1 and Figure 6—source data 1 for raw values, statistics and additional double mutant combinations. (I) Cis-trans mutant analysis. TFBS mutations are combined with single mutants of the HSN TF collective. n > 100 cells each genotype. See Figure 6—source data 1 raw values and statistics.


