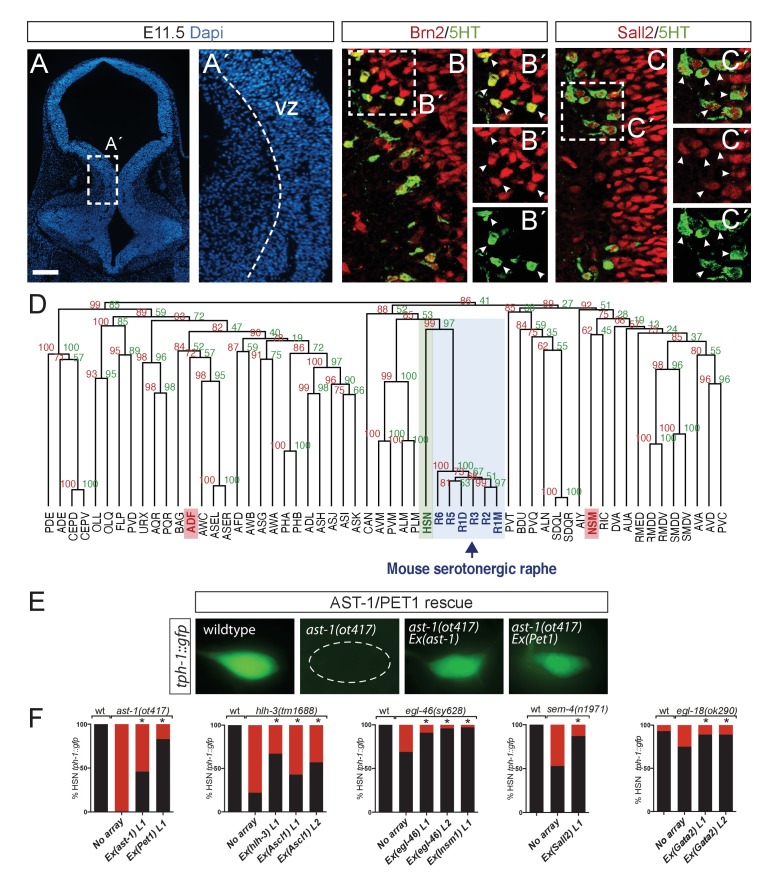
Figure 8. Deep homology between HSN and mouse serotonergic raphe neurons.
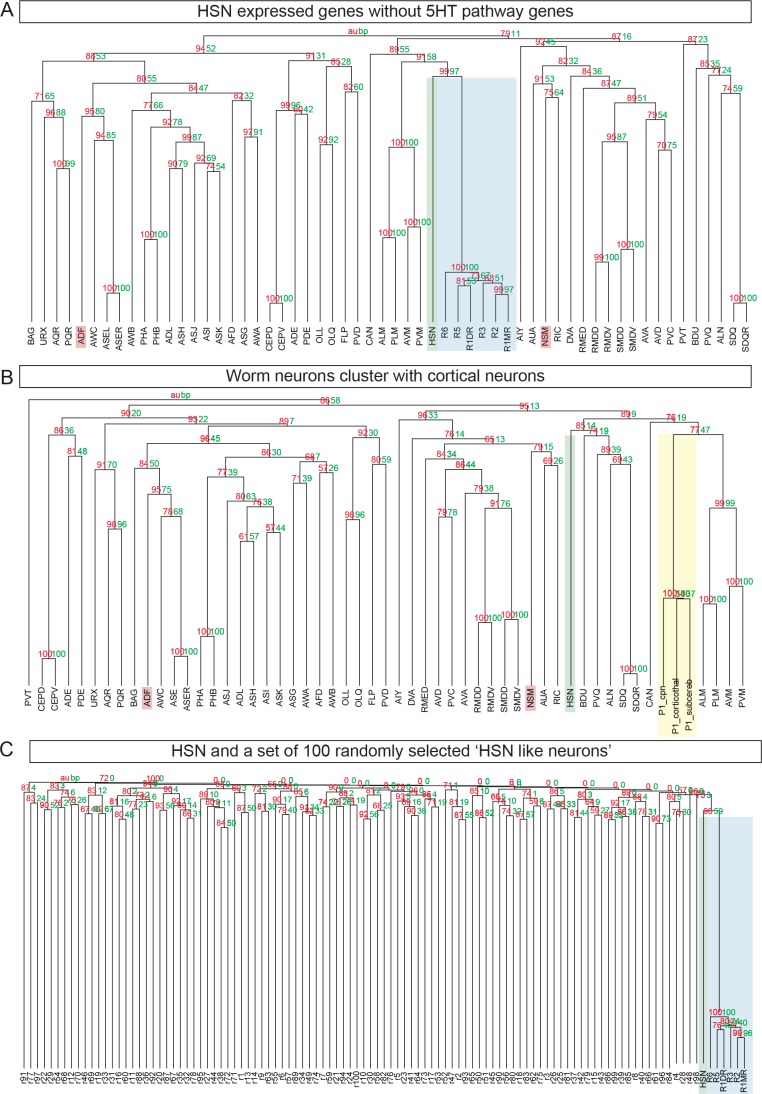
(A) Micrograph of mouse embryonic day 11.5 hindbrain coronal section with DAPI staining. Square box indicates the region in A', B and C panels. VZ: ventricular zone, where progenitors are located. Scale bar: 100 μm. (B) BRN2 and 5HT co-staining. BRN2 is expressed in progenitors and differentiating serotonergic neurons. Arrowheads indicate double labeled cells. Scale bar: 20 μm. (C) SALL2 and 5HT co-staining. SALL2 is expressed in progenitors and differentiating serotonergic neurons. Arrowheads indicate double labeled cells. Scale bar: 20 μm. (D) Hierarchical clustering analysis of C. elegans neuron expression profiles with mouse serotonergic raphe neurons shows that HSN (in green) is closest to mouse serotonergic neurons (in blue). Other C. elegans serotonergic neuron classes (ADF and NSM in red) do not show a close relationship with mouse serotonergic raphe. R1D: Dorsal serotonergic neurons from rhombomere r1; R1M: Medial serotonergic neurons from rhombomere r1; R2: serotonergic neurons from rhombomere r2; R3: serotonergic neurons from rhombomere r3; R5: serotonergic neurons from rhombomere r5; R6: serotonergic neurons from rhombomere r6. See also Figure 8—figure supplement 1. (E) Micrographs showing tph-1::gfp expression in wild type animals, ast-1(ot417) mutants, and ast-1(ot417) mutants rescued with ast-1 cDNA or mouse Pet1 cDNA expressed under the bas-1 promoter whose expression in not affected in this mutant background. (F) Quantification of tph-1::gfp HSN expression rescue of different HSN TF collective mutants with worm and mouse ortholog cDNAs. n > 100 cells per condition. Fisher's exact test, *: p-value<0.05. ‘L’ indicates the transgenic line number.


