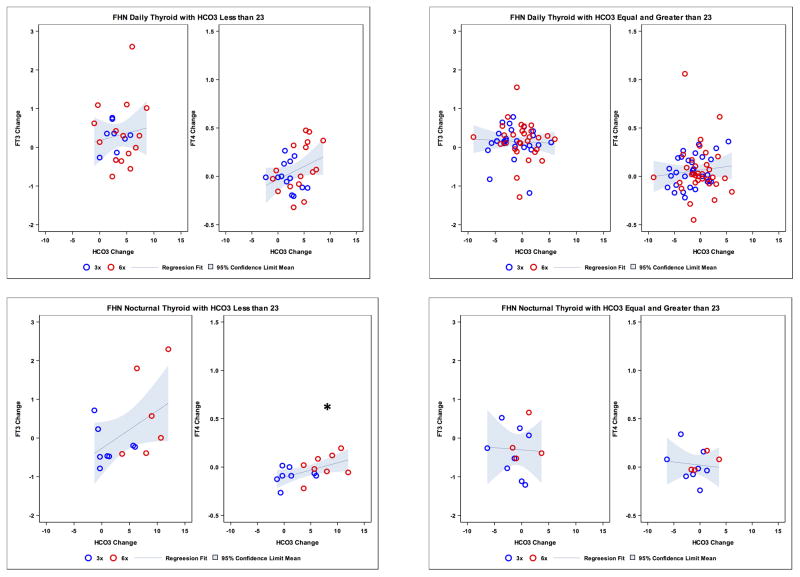
Figure 2.
Upper panel: Scatterplot of changes in bicarbonate (HCO3−) levels (mMol/L) and changes in 3,5,3′-triiodo-L-thyronine (FT3) (pg/mL) and free thyroxine (FT4) (ng/dL) levels in Daily Dialysis Trial according to HCO3− less than 23 (left side) and equal and greater than 23 (right side). Lower panel: Scatterplot of changes in bicarbonate (HCO3−) levels (mMol/L) and changes in FT3 (pg/mL) and FT4 (ng/dL) levels in Nocturnal Dialysis Trial according to HCO3− less than 23 (left side) and equal and greater than 23 (right side). FHN, Frequent Hemodialysis Network.
*P = 0.03

