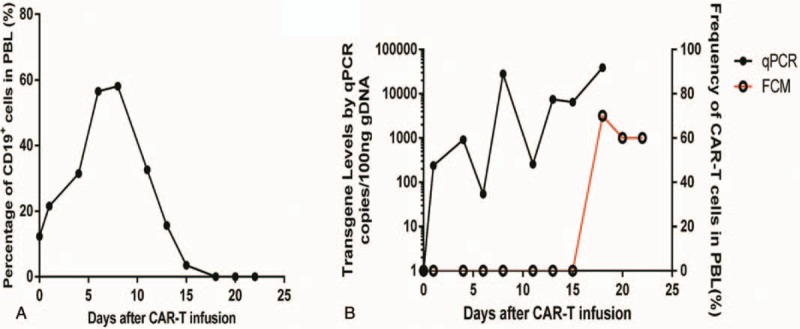
Figure 2.

Cellular kinetic profiles of CD19+ cells and CAR-T cells in the blood after CD19 CAR-T cell infusion. A, Percentage of CD19+ cells in the blood on the indicated days after CAR-T cell infusion. B, CAR-T cell persistence in the blood as integrated transgene copies per 100 ng DNA measured by qPCR or frequency in the blood measured by flow cytometry. CAR = chimeric antigen receptor, qPCR = real-time quantitative polymerase chain reaction.
