Figure 4.

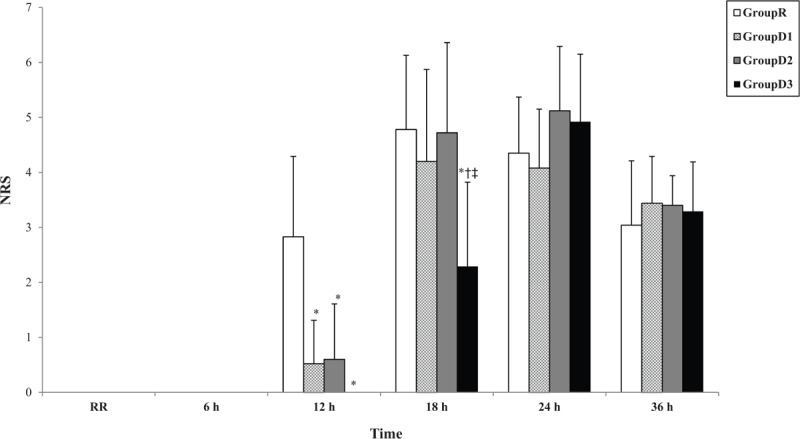
Numeric pain rating scale time courses. ∗P < .05 when compared group with group R; †P < .05 when compared group with group D1; ‡P < .05 when compared group with group D2. Time values indicated by RR through 36 h are as in Fig. 2.

Numeric pain rating scale time courses. ∗P < .05 when compared group with group R; †P < .05 when compared group with group D1; ‡P < .05 when compared group with group D2. Time values indicated by RR through 36 h are as in Fig. 2.