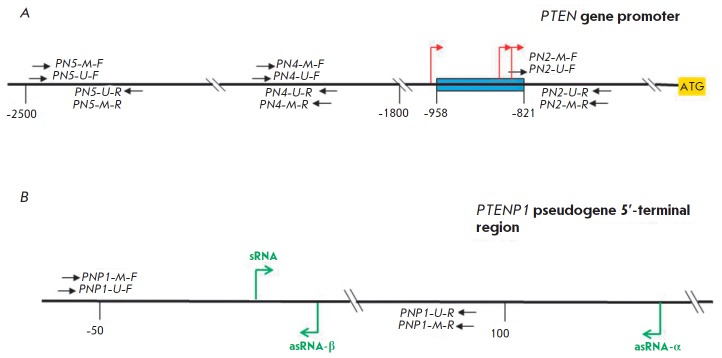
Fig. 2.
Studied regions of the PTEN gene (A) and PTENP1 pseudogene (B). A blue rectangle denotes the minimum promoter region of the PTEN gene; bent red and green arrows denote the main transcription initiation sites of the PTEN gene and of PTENP1 pseudogene, respectively; black arrows indicate the location of primers for MS PCR; sRNA is sense PTENP1 RNA; asRNA-α(-β) is antisense PTENP1 RNA-α(-β); the numbers denote the distance from the ATG codon (A) or sRNA synthesis start site (B)

