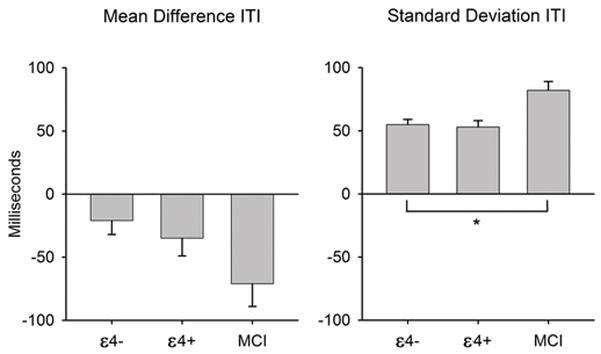
Figure 1.

Paced finger-tapping performance by group. Left panel presents mean accuracy, represented by mean inter-tap interval (ITI) minus the target ITI (333 milliseconds). Right panel presents mean standard deviation of the ITI, a measure of intraindividual variability. Error bars represent standard error of the mean. ε4 = aolipoprotein E-epsilon 4; MCI = mild cognitive impairment; ITI = inter-tap interval.
* p < .05.
