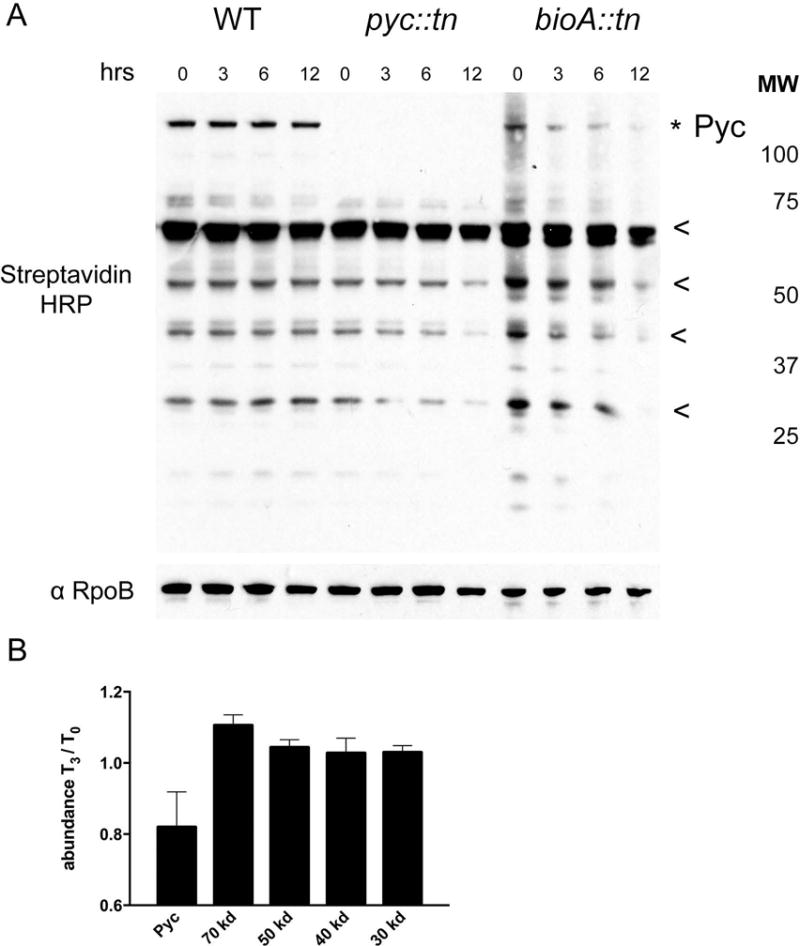
Figure 6. Analysis of protein biotinylation during biotin deprivation.

(A) Streptavidin HRP Western blot of total biotinylated protein in WT (MGM8007), pyc::tn (MGM8008), and bioA::tn (MGM8009) during biotin deprivation for 0, 3, 6, and 12 hours. Biotinylated proteins were visualized using streptavidin-HRP with anti-RpoB as a loading control. Pyruvate carboxylase (topmost band, marked with *) was absent in pyc::tn, as expected, but pyc::tn showed no obvious deficiencies in other biotinylated proteins. The biotinylated proteins used for quantitation (see Figure S3) are marked with * or <. (B) Quantitation of the fraction of the indicated proteins remaining at 3 hours of biotin deprivation compared to T0 in a bioA::tn strain. Error bars are standard deviations of three biological replicates.
