
Figure 7. Significantly perturbed metabolites in pyc::tn.
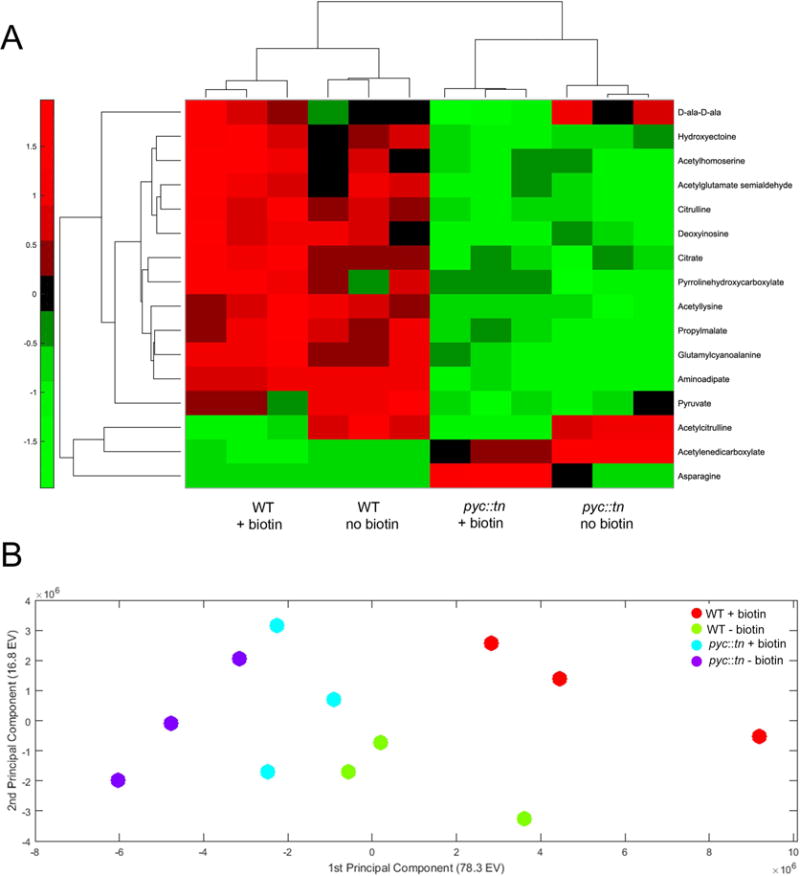
(A) We collected metabolites from three replicates of WT (MGM8007) and pyc::tn (MGM8008) after three hours of growth with or without biotin. Metabolite levels were normalized to total biomass measured in each replicate using a generalized linear regression model. Metabolites which were significantly different between strains or conditions are summarized in the heat map. Higher abundance for a metabolite than expected by the model given the strain’s biomass is indicated in red, and lower abundance in green. (B) Principal-component analysis (PCA) of all metabolites. Each dot is one replicate of the indicated strain/biotin condition.