
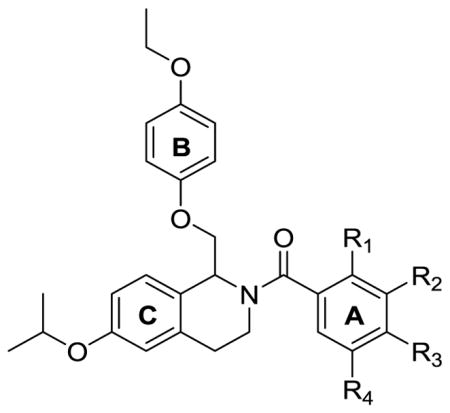
Table 3.
Optimization of potency based on substituent placement and identity of A-ring.
| ||||||||||
|---|---|---|---|---|---|---|---|---|---|---|
| I30μM / Icontrol (mean ± SEM, %) | EC50 (max.) (μM %)a | |||||||||
| # | R1 | R2 | R3 | R4 | GluN2B | GluN2C | GluN2D | GluN2B | GluN2C | GluN2D |
| 95 | H | H | H | H | 88 ± 1.1 | 83 ± 2.5 | 69 ± 2.3 | -- | -- | -- |
| 92b | H | Cl | H | H | 145 ± 7.8 | 126 ± 2.8 | 102 ± 2.0 | 5.3 (158%) | 1.8 (128%) | -- |
| 96 | H | Br | H | H | 136 ± 7.9 | 133 ± 5.1 | 98 ± 1.9 | 3.4 (137%) | 1.8 (135%) | -- |
| 97 | H | F | H | H | 147 ± 3.7 | 104 ± 2.2 | 91 ± 1.7 | 7.2 (152%) | -- | -- |
| 98 | H | CF3 | H | H | 124 ± 7.0 | 129 ± 3.8 | 95 ± 8.6 | 2.4 (124%) | 1.3 (130%) | -- |
| 99 | H | Ph | H | H | 112 ± 4.4 | 92 ± 3.7 | 92 ± 1.9 | -- | -- | -- |
| 100 | H | Me | H | H | 78 ± 1.2 | 67 ± 2.1 | 43 ± 2.3 | -- | -- | -- |
| 101 | H | OMe | H | H | 89 ± 5.1 | 65 ± 4.1 | 44 ± 4.5 | -- | -- | -- |
| 102 | F | H | H | H | 61 ± 2.4 | 68 ± 4.1 | 55 ± 4.5 | -- | -- | -- |
| 103 | Cl | H | H | H | 67 ± 4.1 | 93 ± 6.3 | 79 ± 3.4 | -- | -- | -- |
| 104 | H | H | F | H | 118 ± 5.8 | 107 ± 6.7 | 90 ± 3.7 | -- | -- | -- |
| 105 | H | H | Cl | H | 112 ± 2.1 | 101 ± 7.8 | 88 ± 7.7 | -- | -- | -- |
| 106 | H | F | F | H | 172 ± 6.0 | 145 ± 6.6 | 133 ± 3.7 | 3.7 (173%) | 1.8 (150%) | 2.9 (137%) |
| 107c | H | Cl | Cl | H | 133 ± 5.3 | 150 ± 8.1 | 122 ± 4.1 | ND | ND | ND |
| 108 | H | Cl | F | H | 169 ± 7.8 | 159 ± 6.3 | 133 ± 4.8 | 2.2 (170%) | 1.3 (162%) | 2.2 (137%) |
| 109c | H | Cl | H | Cl | 105 ± 3.3 | 97 ± 2.9 | 80 ± 3.0 | -- | -- | -- |
Fitted EC50 values are shown to two significant figures when potentiation at 30 μM exceeded 120%; values in parentheses are the fitted maximum response as a percentage of the initial glutamate (100 μM) and glycine (30 μM) current. Data are from between 6–17 oocytes from 2–3 frogs for each compound and receptor tested.
Compound 92 from Table 1 is included here for comparison.
Current ratio reported is for 3 μM (compound 107) or 10 μM (compounds 99, 109) because these compounds were not soluble at 10 or 30 μM, respectively.
ND (not determined) indicates that we could not obtain data at high enough concentrations to determine a fitted maximum value for the concentration-effect curve.