
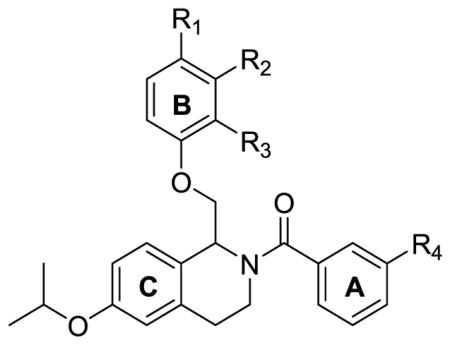
Table 6.
Optimization of potency based on substituent placement and identity of B-ring.
| ||||||||||
|---|---|---|---|---|---|---|---|---|---|---|
| I30μM / Icontrol (mean ± SEM, %) | EC50 (max.) (μM %)a | |||||||||
| # | R1 | R2 | R3 | R4 | GluN2B | GluN2C | GluN2D | GluN2B | GluN2C | GluN2D |
| 2b | OMe | H | H | Cl | 195 ± 11 | 233 ± 18 | 240 ± 29 | 5.2 (202%) | 2.0 (243%) | 3.0 (245%) |
| 110 | H | OMe | H | Cl | 99 ± 5.6 | 132 ± 3.8 | 125 ± 2.4 | -- | 6.2 (132%) | 5.4 (125%) |
| 111c | H | H | OMe | Cl | 108 ± 1.9 | 110 ± 3.6 | 99 ± 1.6 | -- | -- | -- |
| 112 | OCF3 | H | H | Cl | 130 ± 2.7 | 189 ± 8.5 | 150 ± 5.9 | 1.4(130%) | 1.5 (192%) | 1.7 (152%) |
| 92b | OEt | H | H | Cl | 145 ± 7.8 | 126 ± 2.8 | 102 ± 2.0 | 5.3 (158%) | 1.8 (128%) | -- |
| 113 | OiPr | H | H | Cl | 159 ± 7.5 | 134 ± 8.0 | 111 ± 3.8 | 3.8 (160%) | 1.7 (138%) | -- |
| 114 | OMe | H | H | F | 249 ± 7.6 | 271 ± 15 | 402 ± 19 | 29 (391%) | 5.9 (365%) | 11 (493%) |
| 115 | OCF3 | H | H | F | 124 ± 3.8 | 154 ± 5.8 | 136 ± 3.2 | 3.2 (123%) | 2.5 (157%) | 4.1 (137%) |
| 97b | OEt | H | H | F | 147 ± 3.7 | 104 ± 2.2 | 91 ± 1.7 | 7.2 (152%) | -- | -- |
| 116 | OiPr | H | H | F | 179 ± 4.1 | 133 ± 4.5 | 103 ± 2.2 | 7.1 (185%) | 2.7 (135%) | -- |
a
Fitted EC50 values are shown to two significant figures when potentiation at 30 μM exceeded 120%; values in parentheses are the fitted maximum response as a percentage of the initial glutamate (100 μM) and glycine (30 μM) current. Data are from between 7–15 oocytes from 2–3 frogs for each compound and receptor tested.
b
Compounds 2, 92, and 97 were shown in previous tables and were included here for comparison.
c
Current ratio reported for 10 μM due to precipitate at 30 μM.