
Figure 2. Quantitative Comparison of Tyrosine Phosphorylation after Dimerization by EGF or (DNA-BG)2.
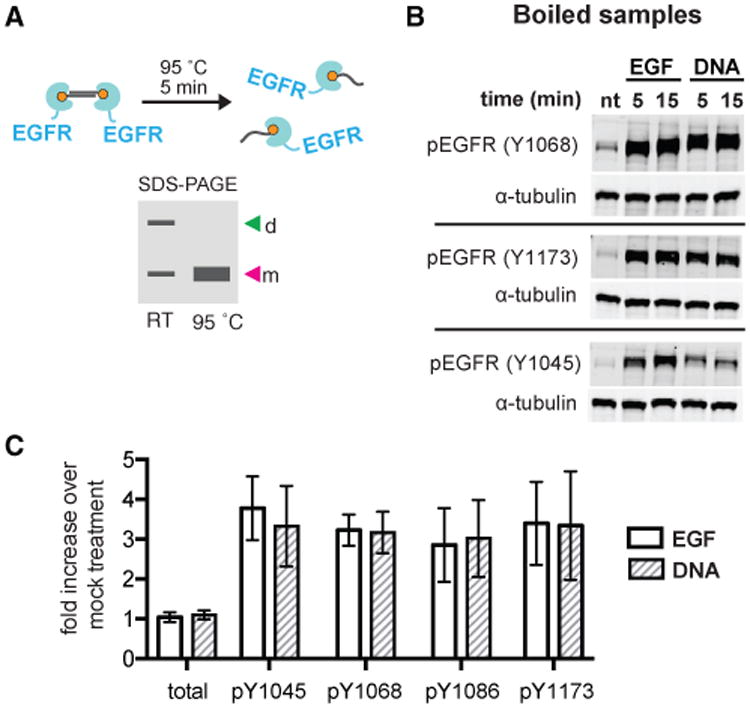
(A) DNA-dimerized receptors can be revealed by PAGE without boiling or can be boiled to reveal a monomer for direct comparison to EGFR monomers. d, dimer; m, monomer; RT, room temperature.
(B) Representative western blot of boiled lysates from cells treated with serum-free media (nt, no treatment), 8 nM EGF or 2 μM (DNA-BG)2 at various tyrosines.
(C) Mean fold increase of total EGFR and phosphotyrosines upon EGF or (DNA-BG)2 treatment compared to no treatment control (n = 3; error bars indicate SD).