
Figure 3. Trapped EGFR Dimers Recruit Adaptors with Similar Stoichiometry to EGF-Stimulated Cells but Do Not Activate Ras.
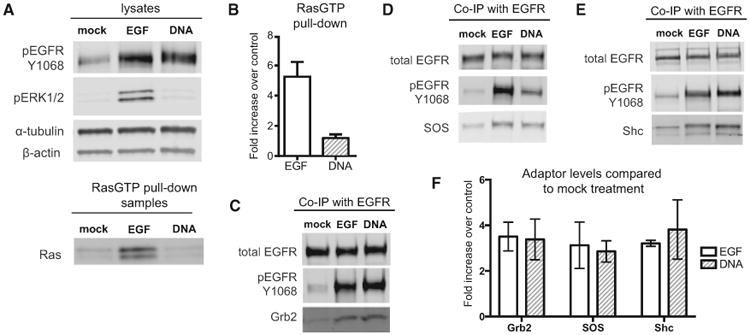
(A) Representative western blot showing lysates from cells treated with either 8 nM EGF, 2 μM (DNA-BG)2, or serum-free media (mock) for 5 min. The same lysates were used in a RasGTP pull-down, and samples were blotted for total Ras.
(B) Mean RasGTP levels in each treatment compared to negative control (n = 3; error bars indicate SD).
(C) Representative blot of Grb2 co-immunoprecipitation (coIP) with EGFR on lysates from treated cells.
(D) Representative blot of SOS coIP with EGFR.
(E) Representative blot of Shc coIP with EGFR.
(F) Quantification of adaptor coIP in treated cells compared to negative controls. Signals for each adaptor were normalized to total EGFR levels in the pull-down sample and plotted as mean fold increase over mock treatment (n = 3; error bars indicate SD).