
Figure 4. Trapped EGFR Dimers Do Not Form Nanoscale Spatial Intermediates or Traffic to Clathrin-Coated Pits.
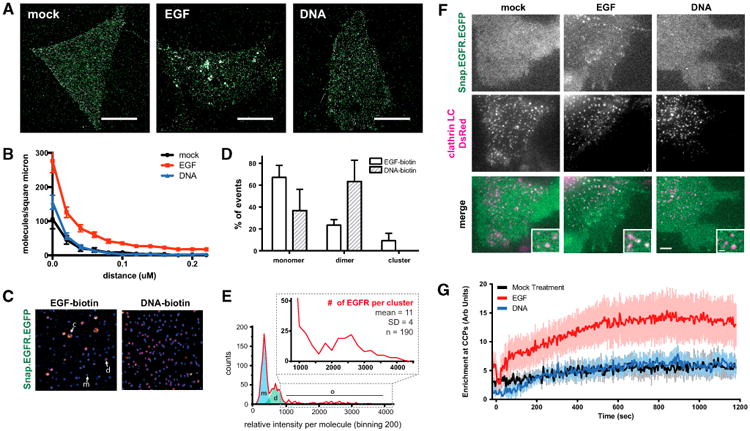
(A) Representative images of HEK293-SNAP-EGFR-mEos cells incubated with serum-free media (mock), 8 nM EGF or 2 μM (DNA-BG)2 for 10 min and then imaged by STORM. Scale bars, 10 μm.
(B) Pairwise correlation analysis of STORM images graphed as median and standard error (n = 10 cells per condition).
(C) Representative images of single-molecule IP of SNAP-EGFR-EGFP cells treated with biotin (bt)-EGF or bt-(DNA-BG)2 for 5 min. Ligand-bound receptors from lysates were immobilized on neutravidin-coated slides and imaged. EGFR monomers (m) appear as blue spots, dimers (d) appear as pink spots, and clusters (c) appear as larger yellow spots.
(D) Mean monomer, dimer, and cluster populations of EGFR graphed as a percentage of the sample (n = 3 independent experiments; error bars indicate SD).
(E) Representative EGF-biotin-treated sample with counts of relative intensity per molecule. The blue shaded region represents the monomer portion, the green shaded region represents the dimer portion, and zoom represents the cluster portion. The average number of EGFR molecules per cluster was estimated by dividing the average intensity of the clusters by the intensity of a monomer.
(F) TIRF images of HEK293 cells co-transfected with SNAP-EGFR-EGFP and clathrin-light chain-dsRed after treatment with 8 nM EGF, 2 μM DNA, or serum-free media at 15 min. Scale bar, 1 μm.
(G) Enrichment of SNAP-EGFR-EGFP at clathrin-coated pits over time after treatment with 8 nM EGF, 2 μM (DNA-BG)2, or serum-free media graphed as mean and SD (n = 10 cells per condition).